Data quality
| This module provides an introduction to data quality. |
Data quality
|
In this video (12:26), you will review terminology used in this course. If you are unable to watch the embedded video, you can download it locally. (MP4 - 56.4 MB) |
Presentation transcript
Click to expand
Slide 1 - Foundations - Data Quality
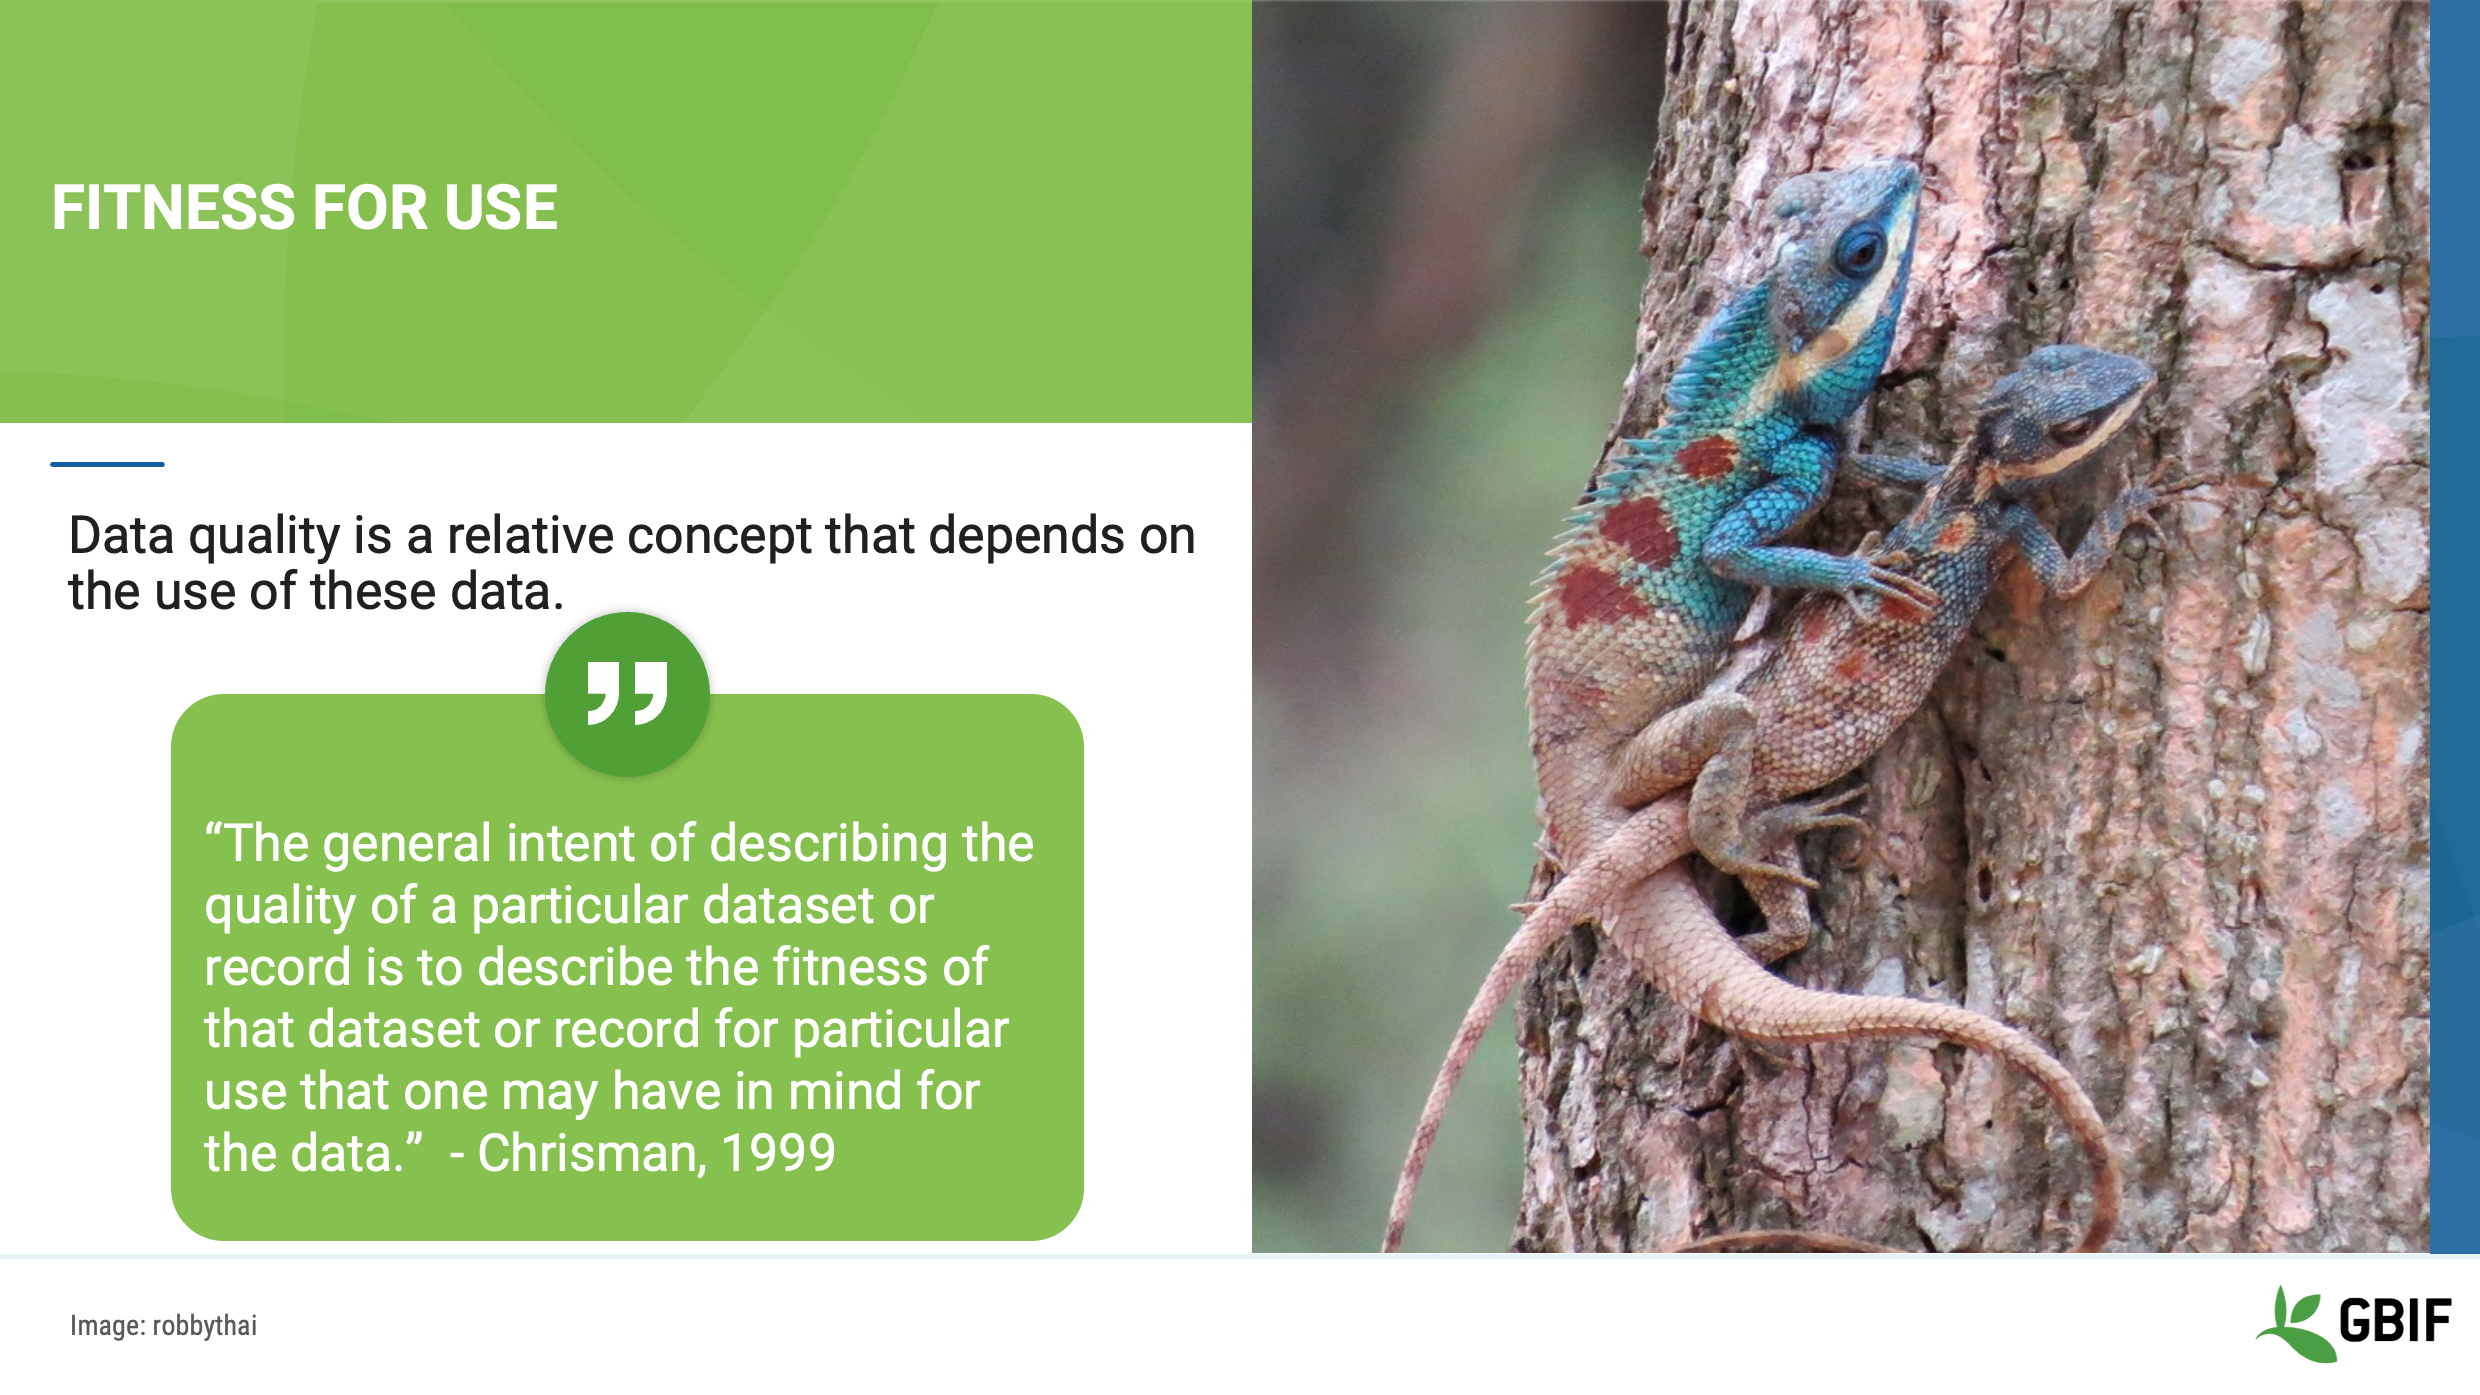
The two primary concepts that we will explore are Fitness for Use and Measures of Quality. These two ideas will lay the foundation for more detailed data quality concepts and techniques in the future.
Photo: GBIF: https://www.gbif.org/occurrence/2550045989 Ictinaetus malayesnsis (Temminck, 1822) Rights holder: cupag_kelley License: http://creativeco…censes/by-nc/4.0/ Reference: https://www.inatu…g/photos/58972976
Slide 2 - Key concepts of data quality
The two primary concepts that we will explore are Fitness for Use and Measures of Quality. These two ideas will lay the foundation for more detailed data quality concepts and techniques in the future.
Photo: GBIF: https://www.gbif.org/occurrence/2550045989 Ictinaetus malayesnsis (Temminck, 1822) Rights holder: cupag_kelley License: http://creativeco…censes/by-nc/4.0/ Reference: https://www.inatu…g/photos/58972976
Slide 3 - Data quality
Before we begin, I’d like to take a moment to explain why data quality is important. Cleanliness is next to Godliness is an expression that we sometimes use to describe the importance of data quality. In this case, Godliness can be understood as holiness, and when something is holy it is considered by many to be worthy of our trust.
So, in the case of data quality, we are more likely to trust and to use data that has been cleaned and cared for.
Photo: GBIF: https://www.gbif.org/occurrence/2611012759 Rhododendron kasangiae D.G. Long & Rushforth Rights holder: Sangay Wangchuk License: http://creativeco…censes/by-nc/4.0/ Reference: https://www.inatu…g/photos/68350578
Slide 4 - Data quality
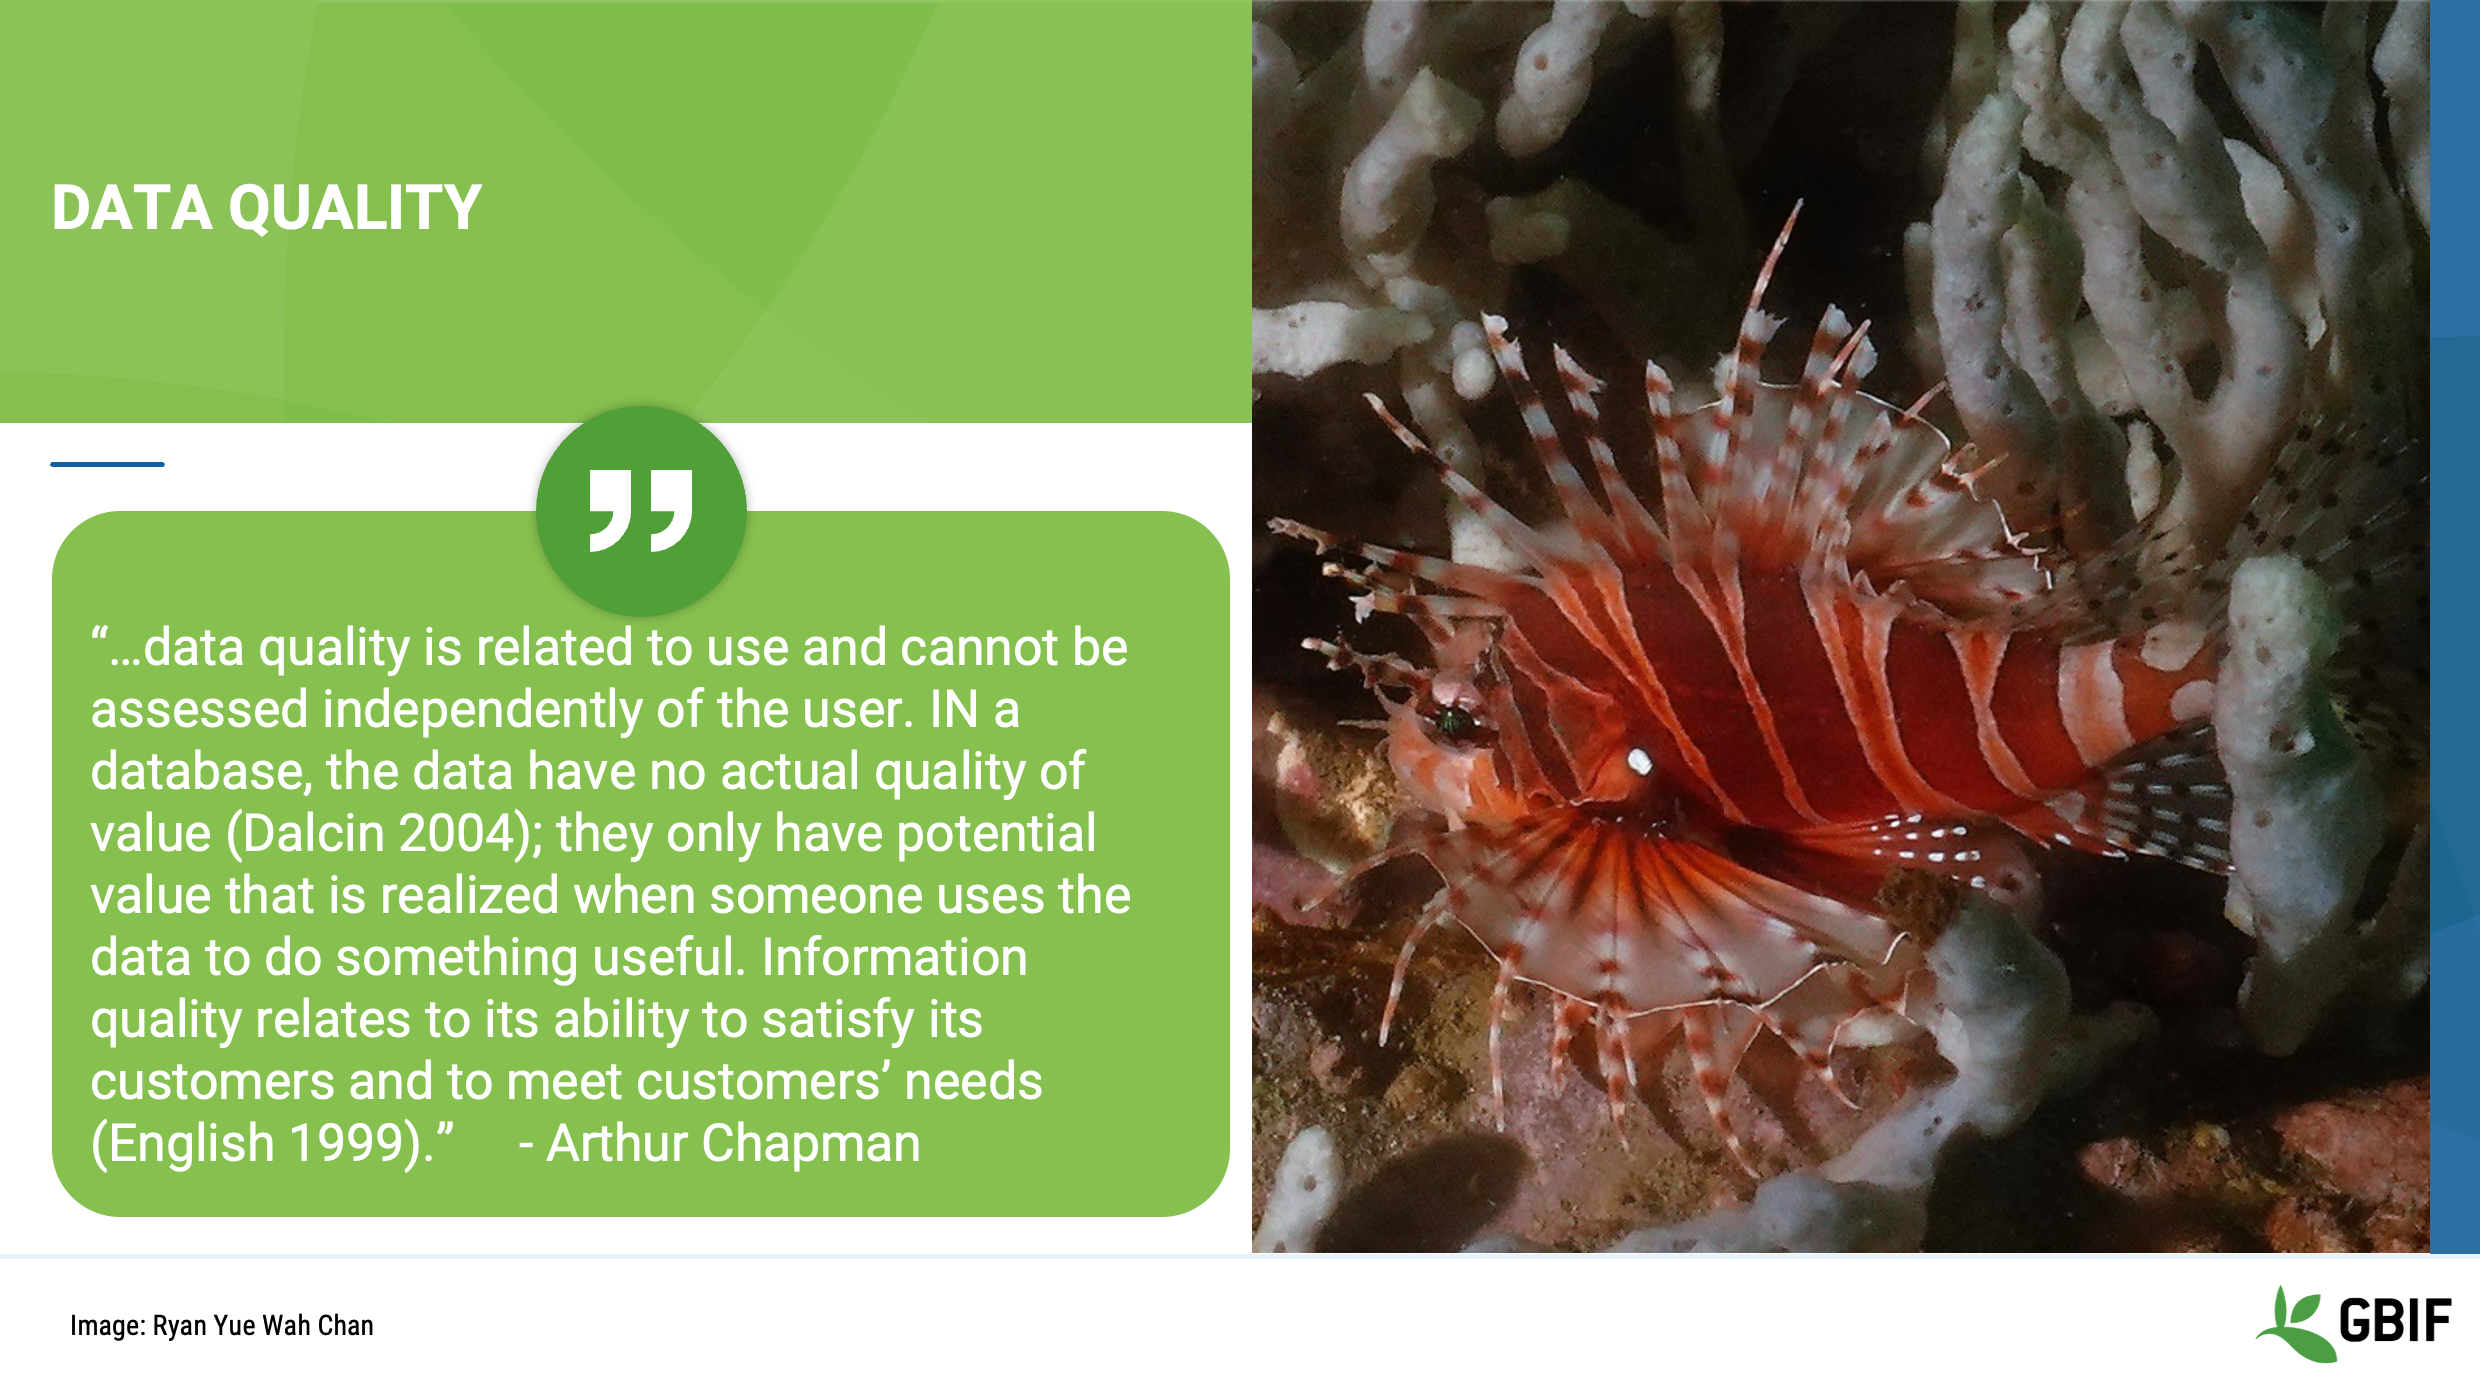
Stepping back into the domain of biodiversity informatics, the classic definition of data quality was coined in 2005 by Arthur Chapman. He wrote:
“data quality is related to use and cannot be assessed independently of the user. In a database, the data have no actual quality or value (Dalcin 2004); they only have potential value that is realized when someone uses the data to do something useful. Information quality relates to its ability to satisfy its customers and to meet customers’ needs (English 1999).” Arthur Chapman”
And so, for us, as individuals who are responsible for maintaining data, we want the data we publish to be as satisfying to all of our potential users as possible. To do this, we seek to provide the highest quality data.
Photo: GBIF: https://www.gbif.org/occurrence/2634451942 Dendrochirus zebra (Cuvier, 1829) Rights holder: Ryan Yue Wah Chan License: http://creativeco…censes/by-nc/4.0/ Reference: https://www.inatu…g/photos/76358738
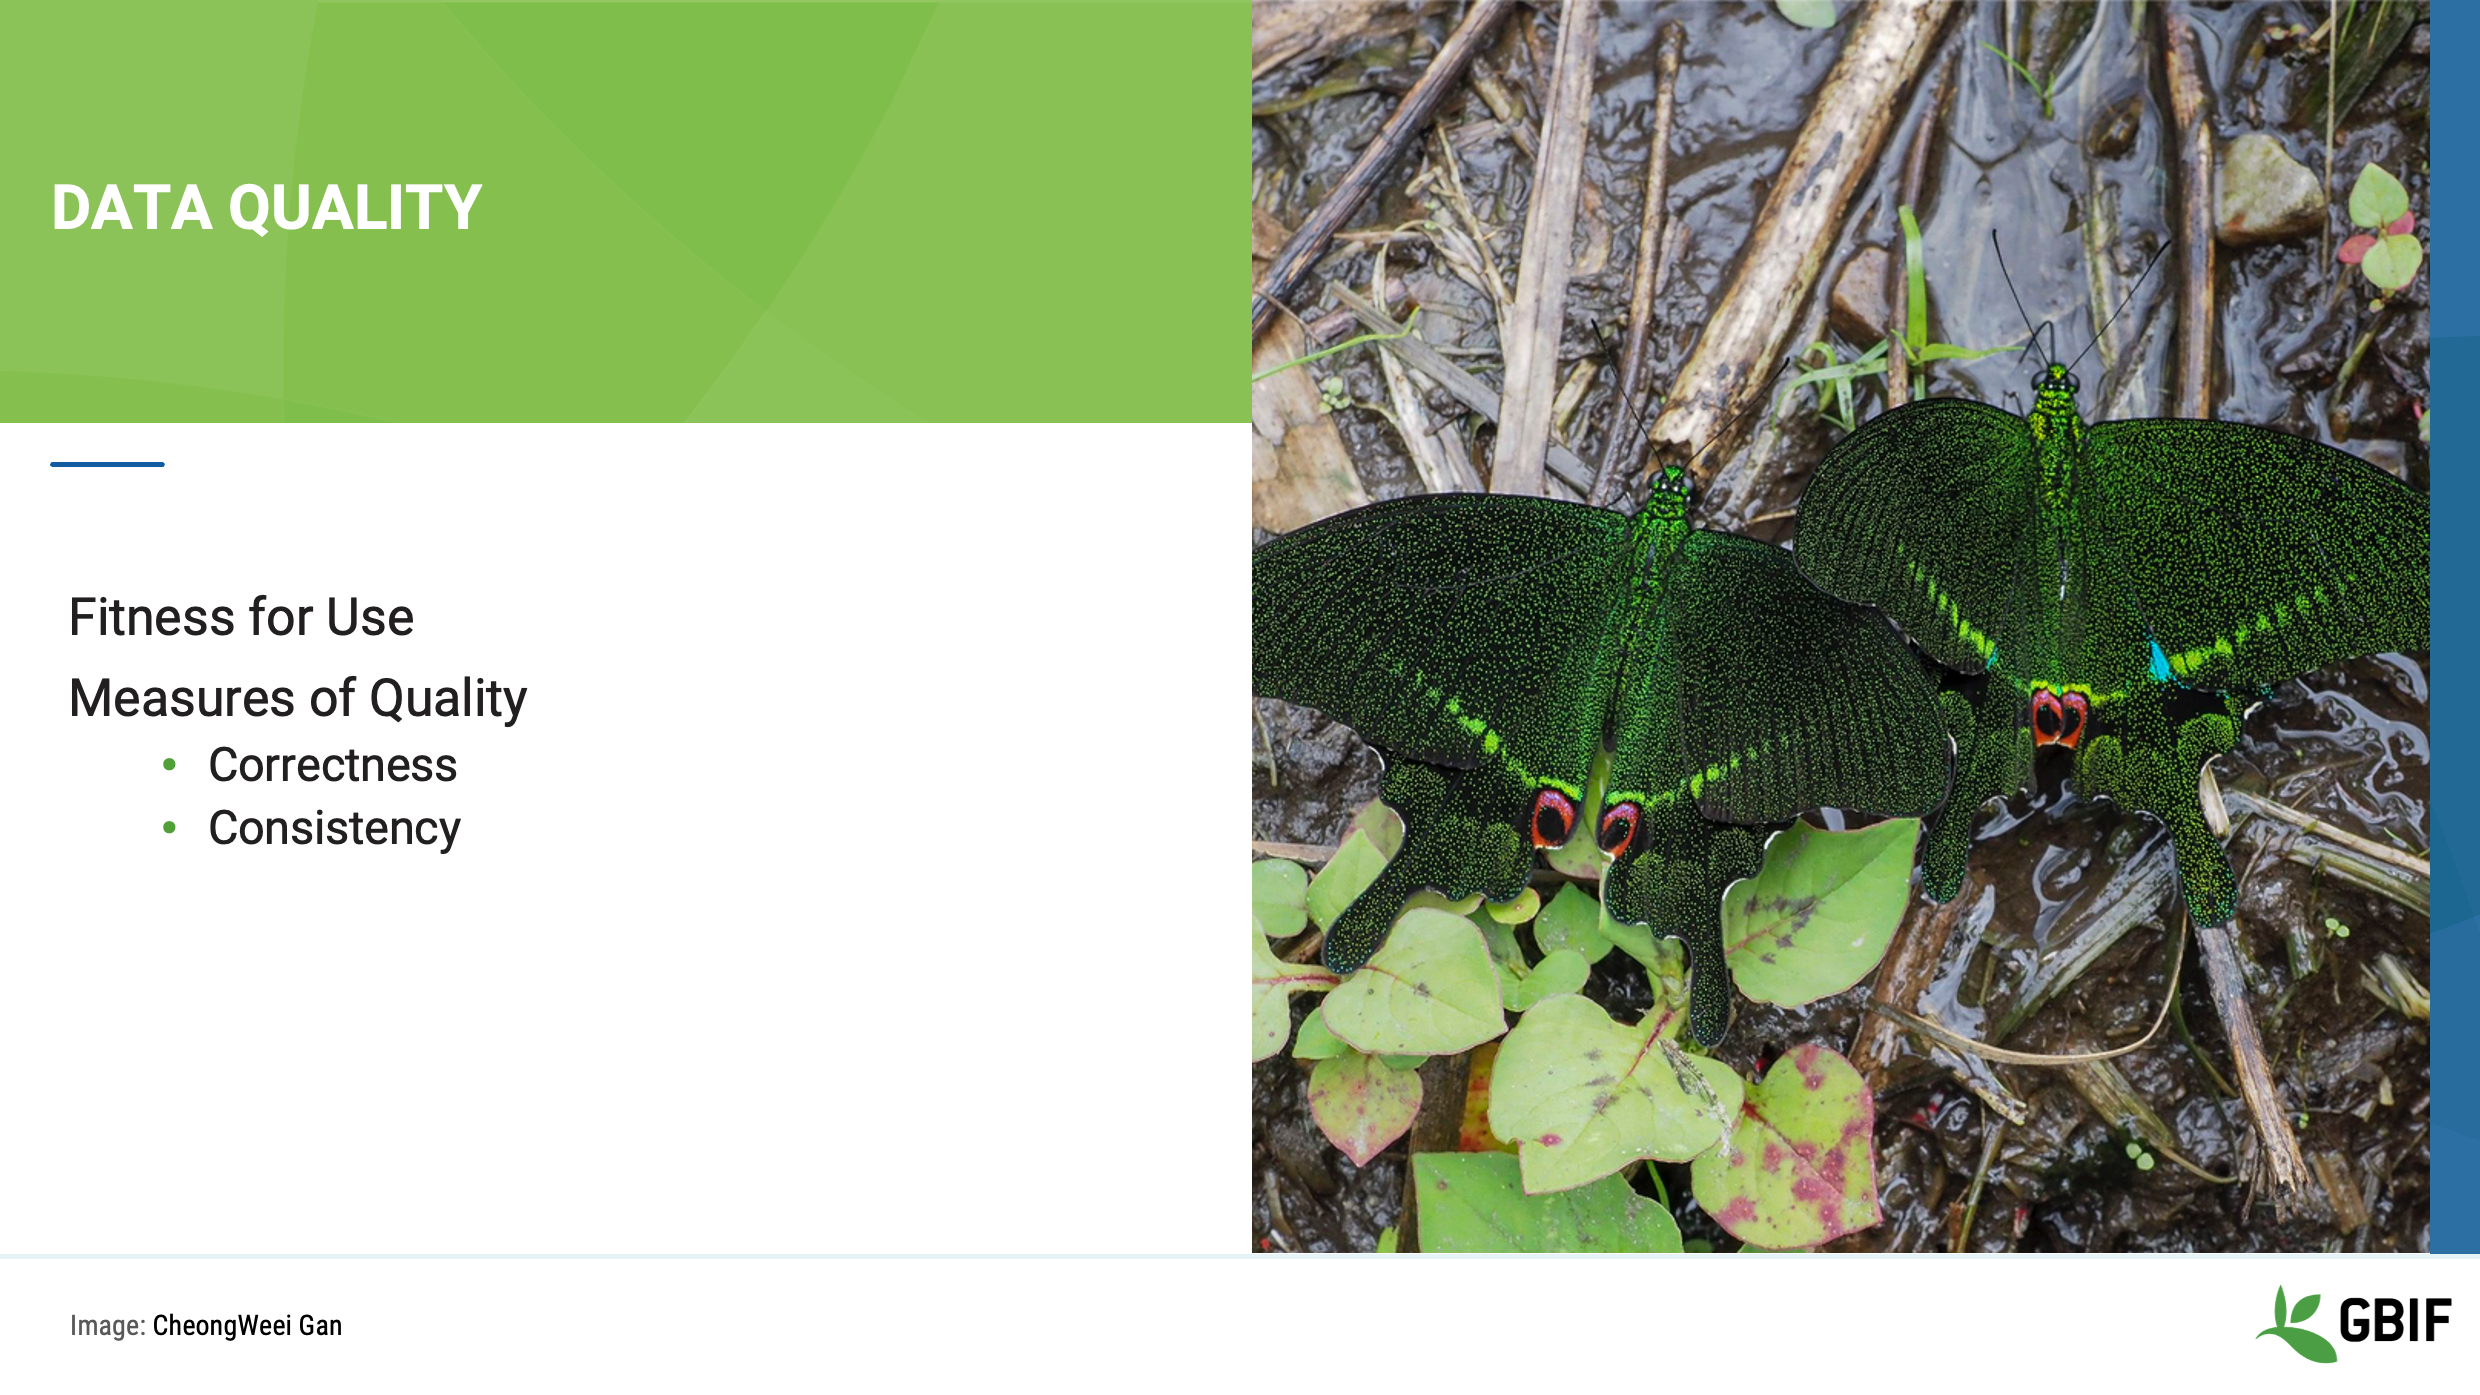
Slide 5 - Data quality
To help you to accomplish this task, we will explore Fitness for Use. We will also explore the Measures of Quality, specifically, Correctness and Consistency.
These are important concepts that you will need to know and be able to articulate about your own data or data that you maintain.
Photo: GBIF: https://www.gbif.org/occurrence/2238803261 Papilio paris Linnaeus, 1758 Rights holder: CheongWeei Gan License: http://creativeco…censes/by-nc/4.0/ Reference: https://www.inatu…g/photos/35832506
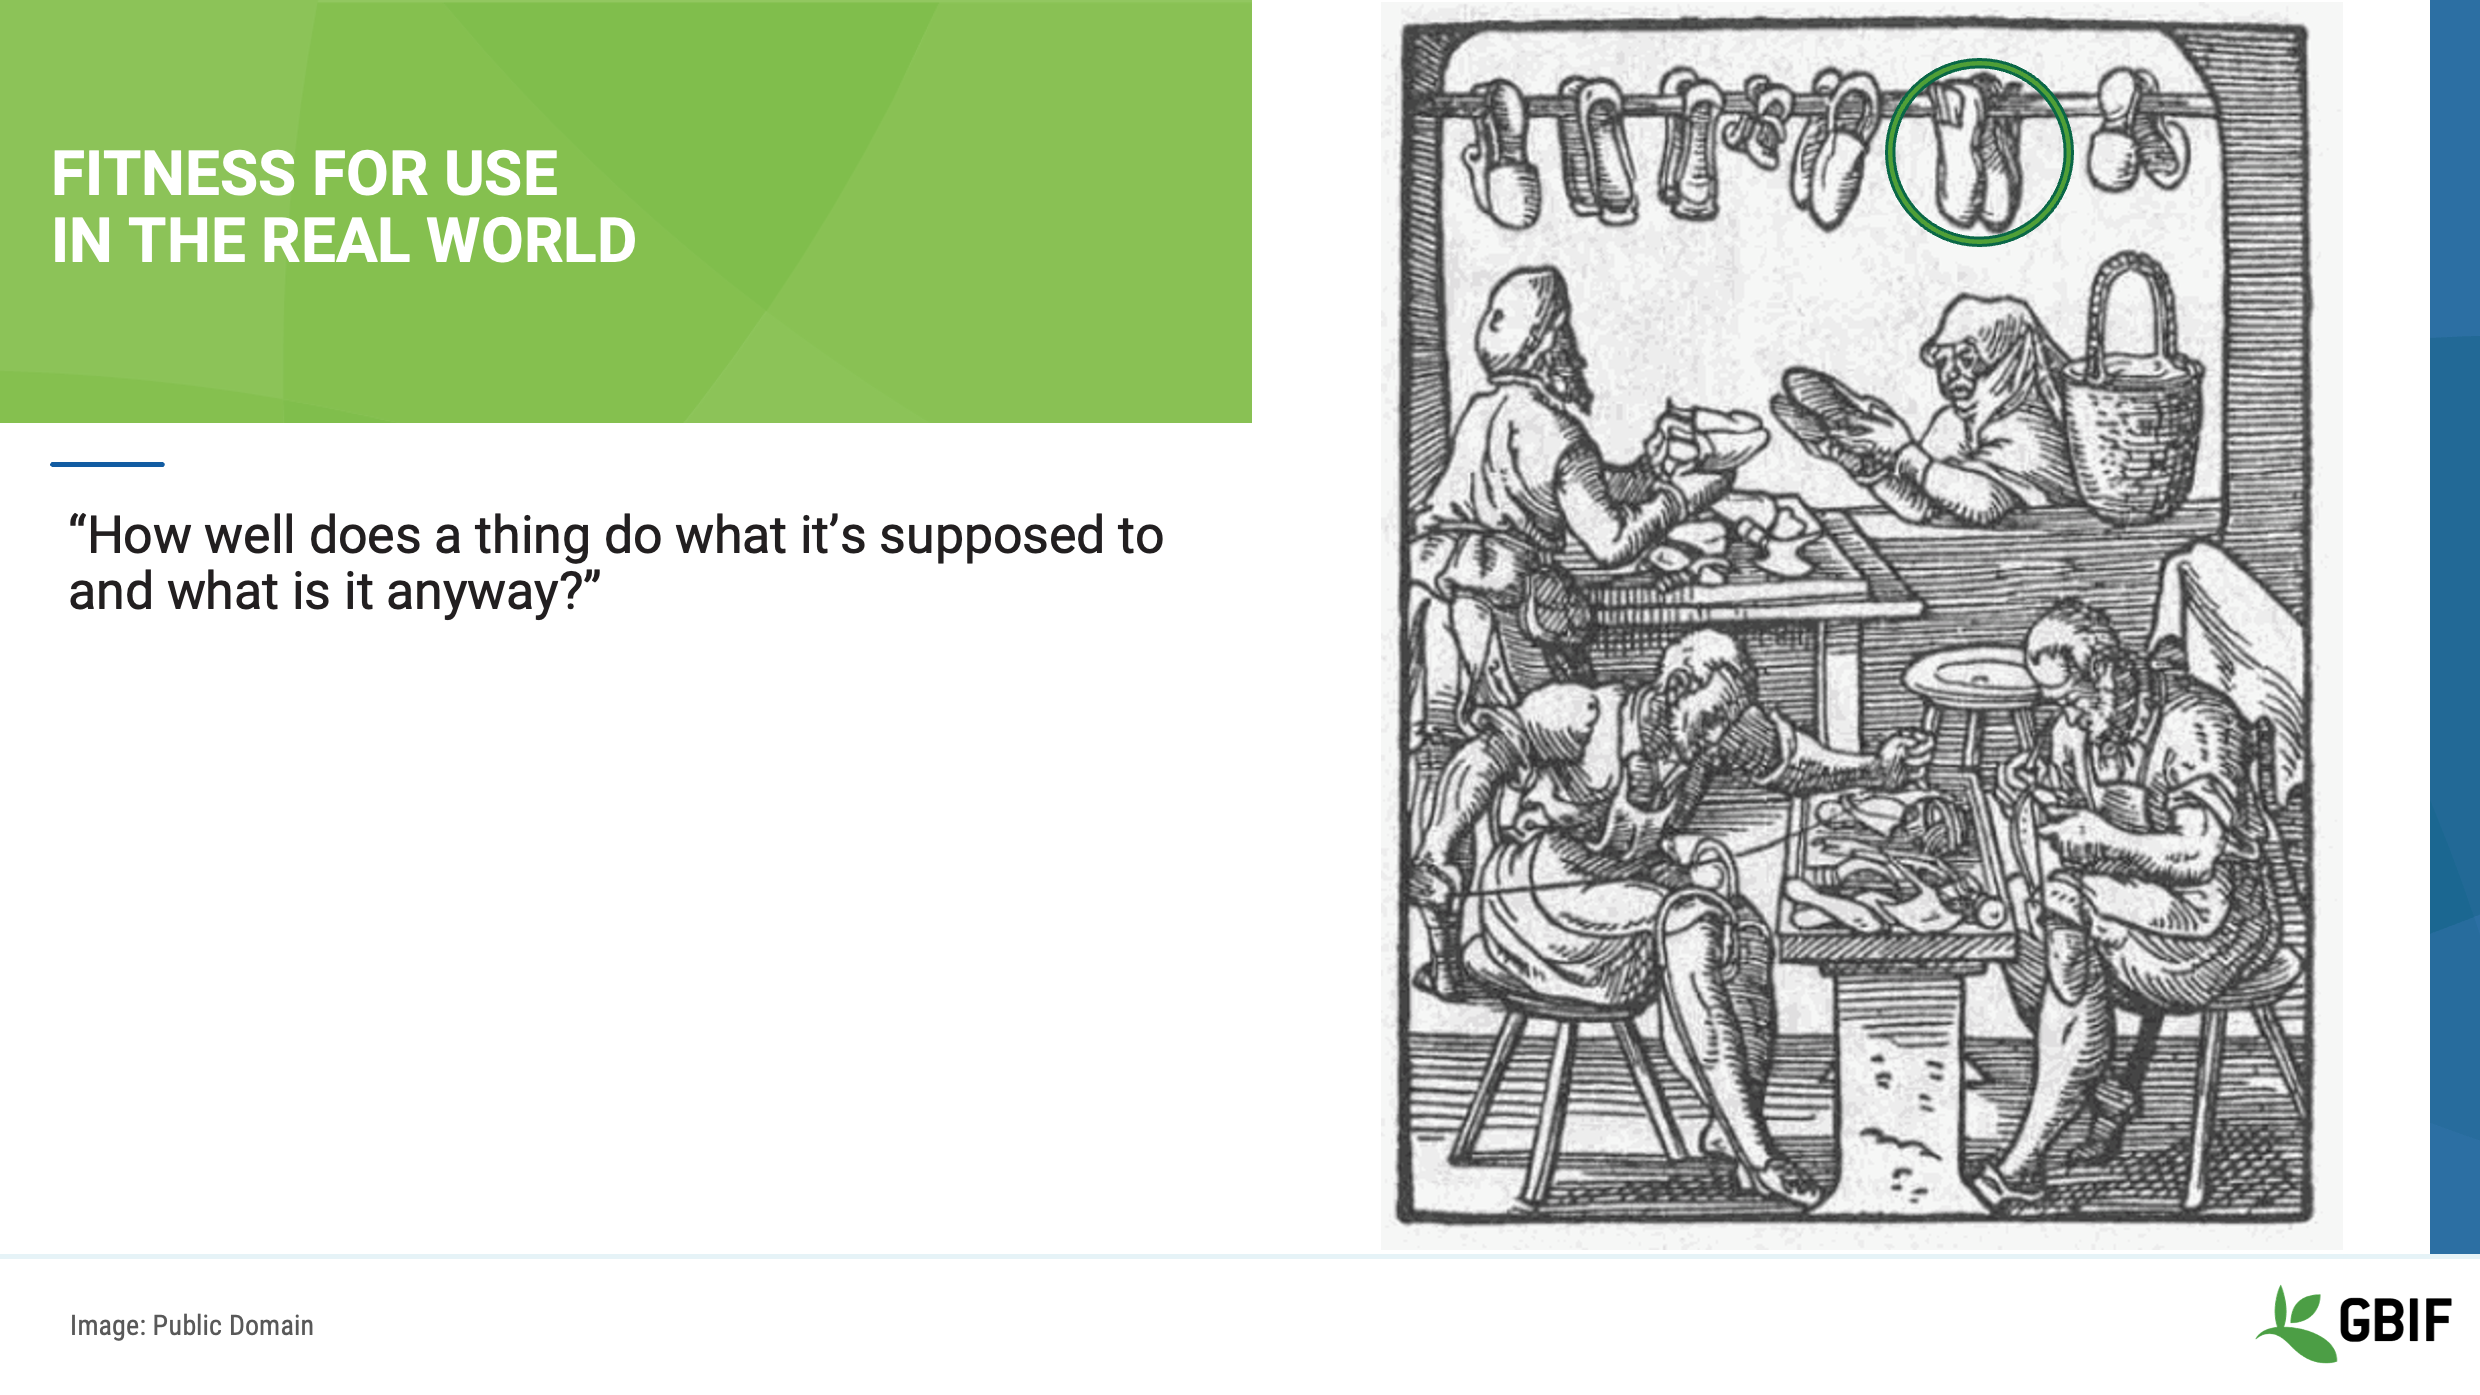
Slide 6 - Fitness for use in the real world
Let’s begin with an example of Fitness for Use. A shoemaker creates a pair of clogs for the purpose of covering a person’s feet, just like those at the top of this image.
Image Reference: https://commons.wikimedia.org/wiki/File:Schuhmacher-1568.png
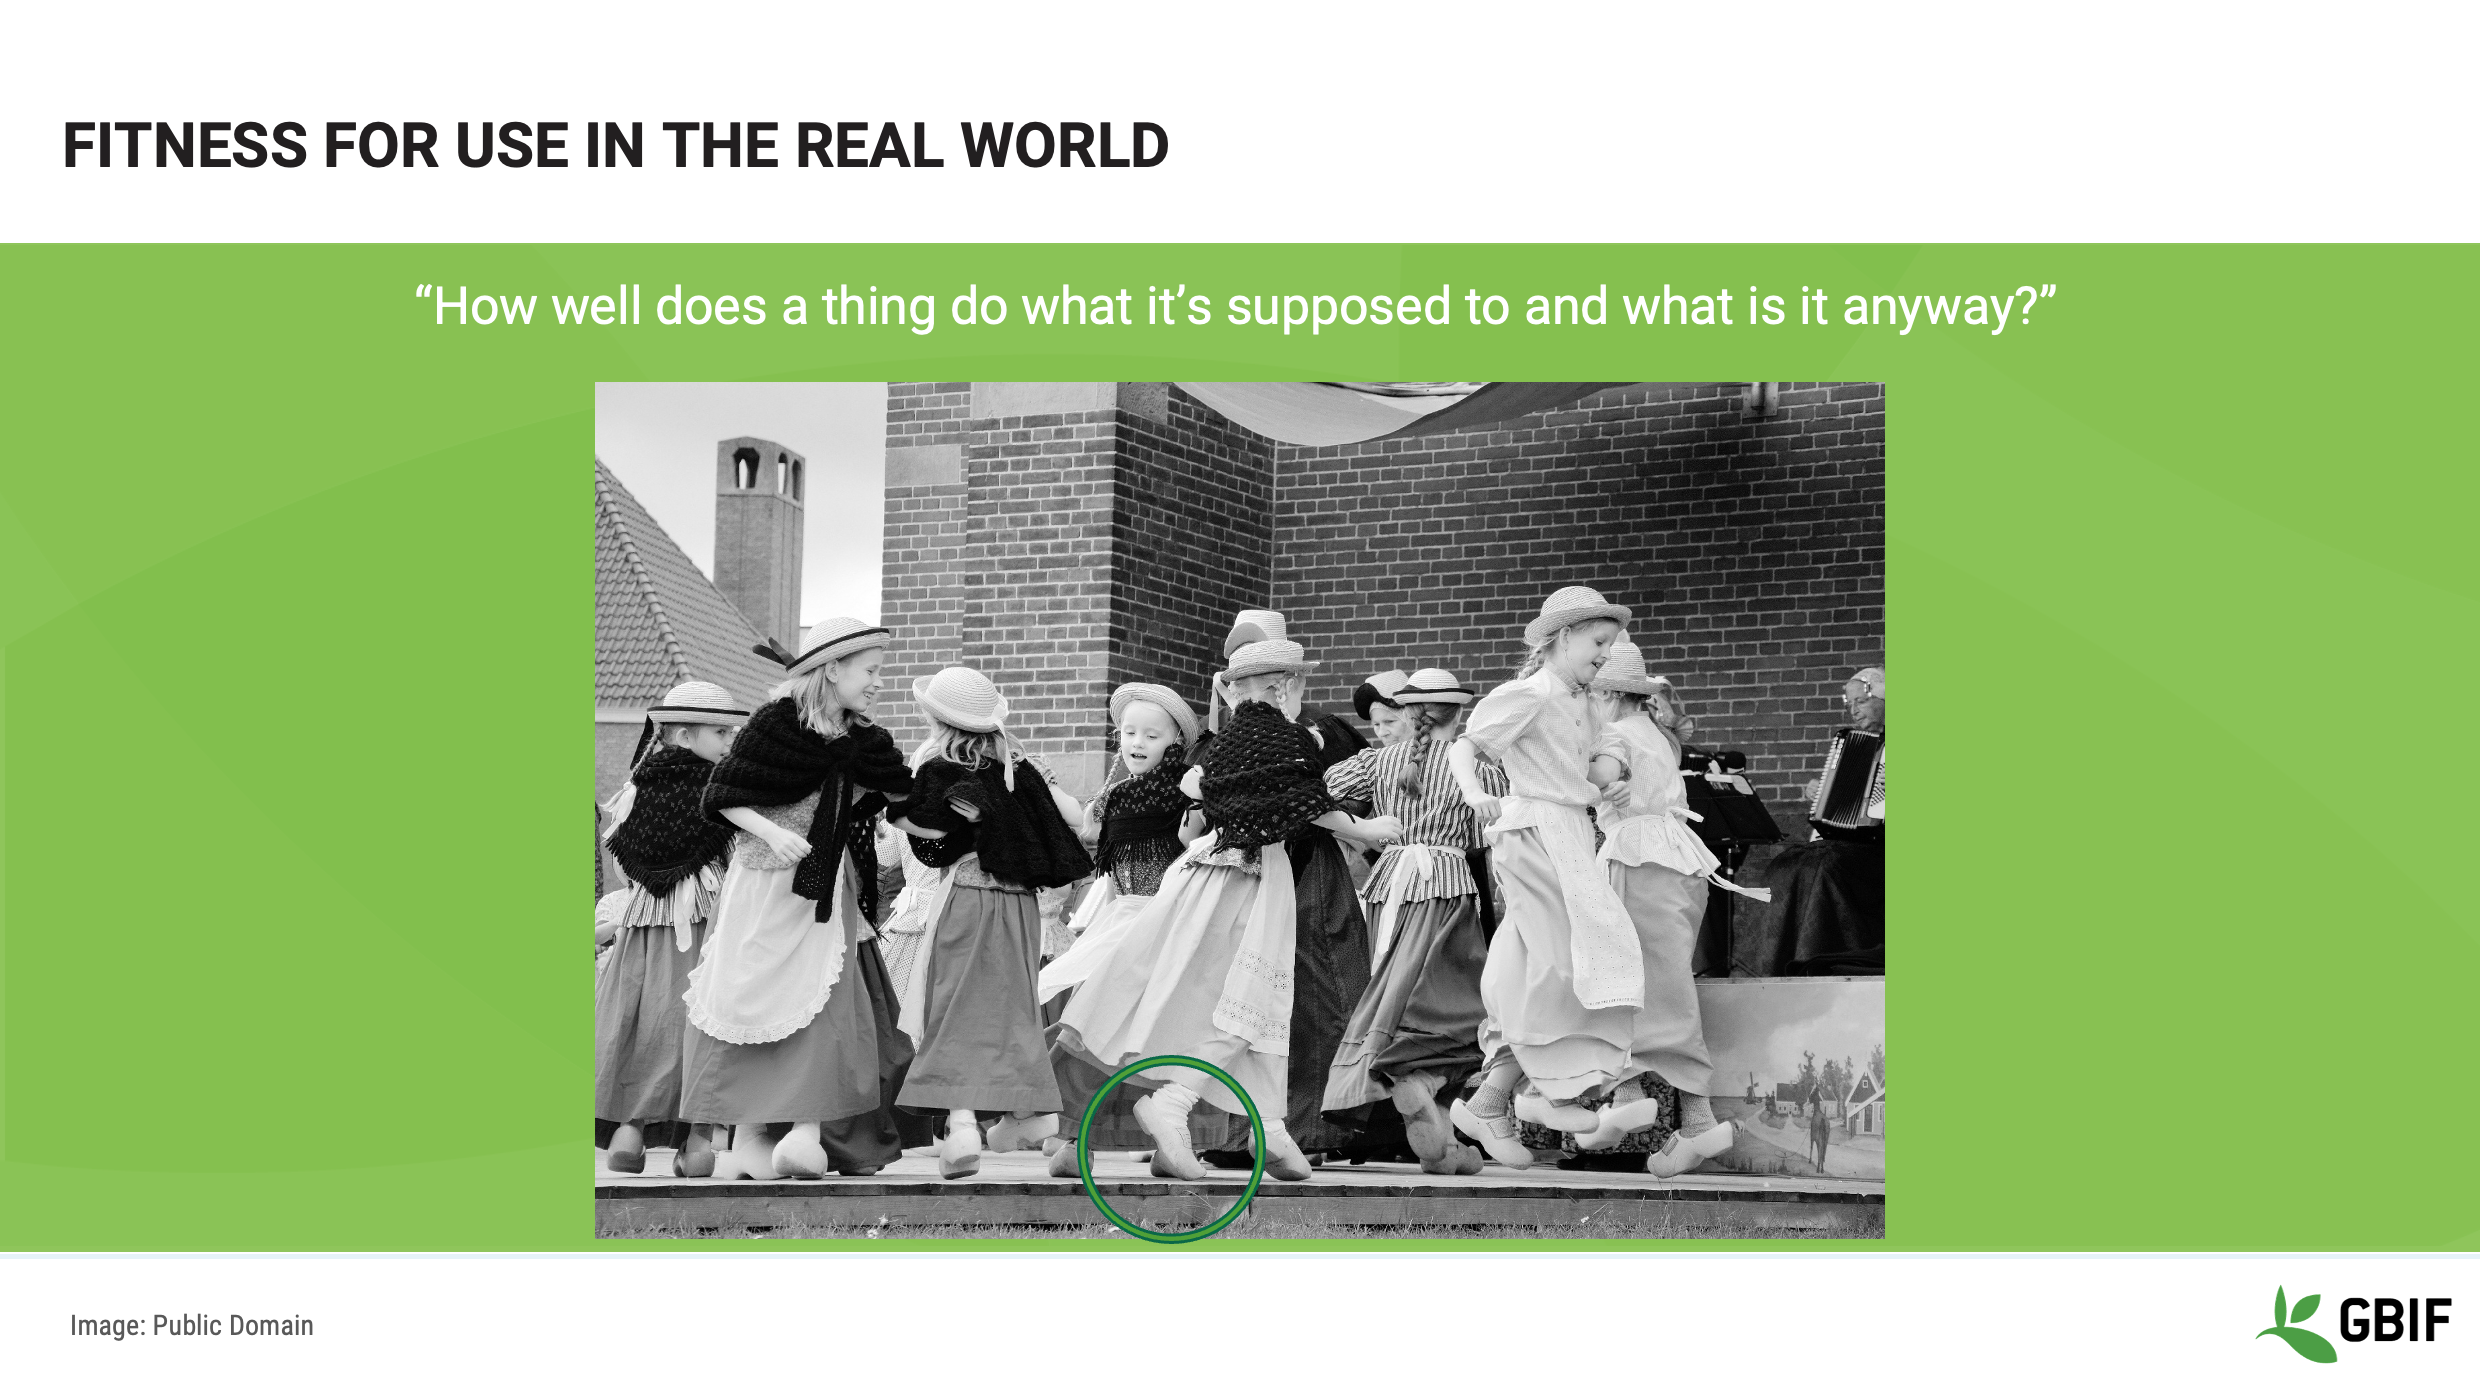
Slide 7 - Fitness for use in the real world
When the shoemaker made these shoes, did he know that this girl would use them for dancing?
Maybe.
Image Reference: https://www.publicdomainpictures.net/en/view-image.php?image=157723&picture=&jazyk=CN
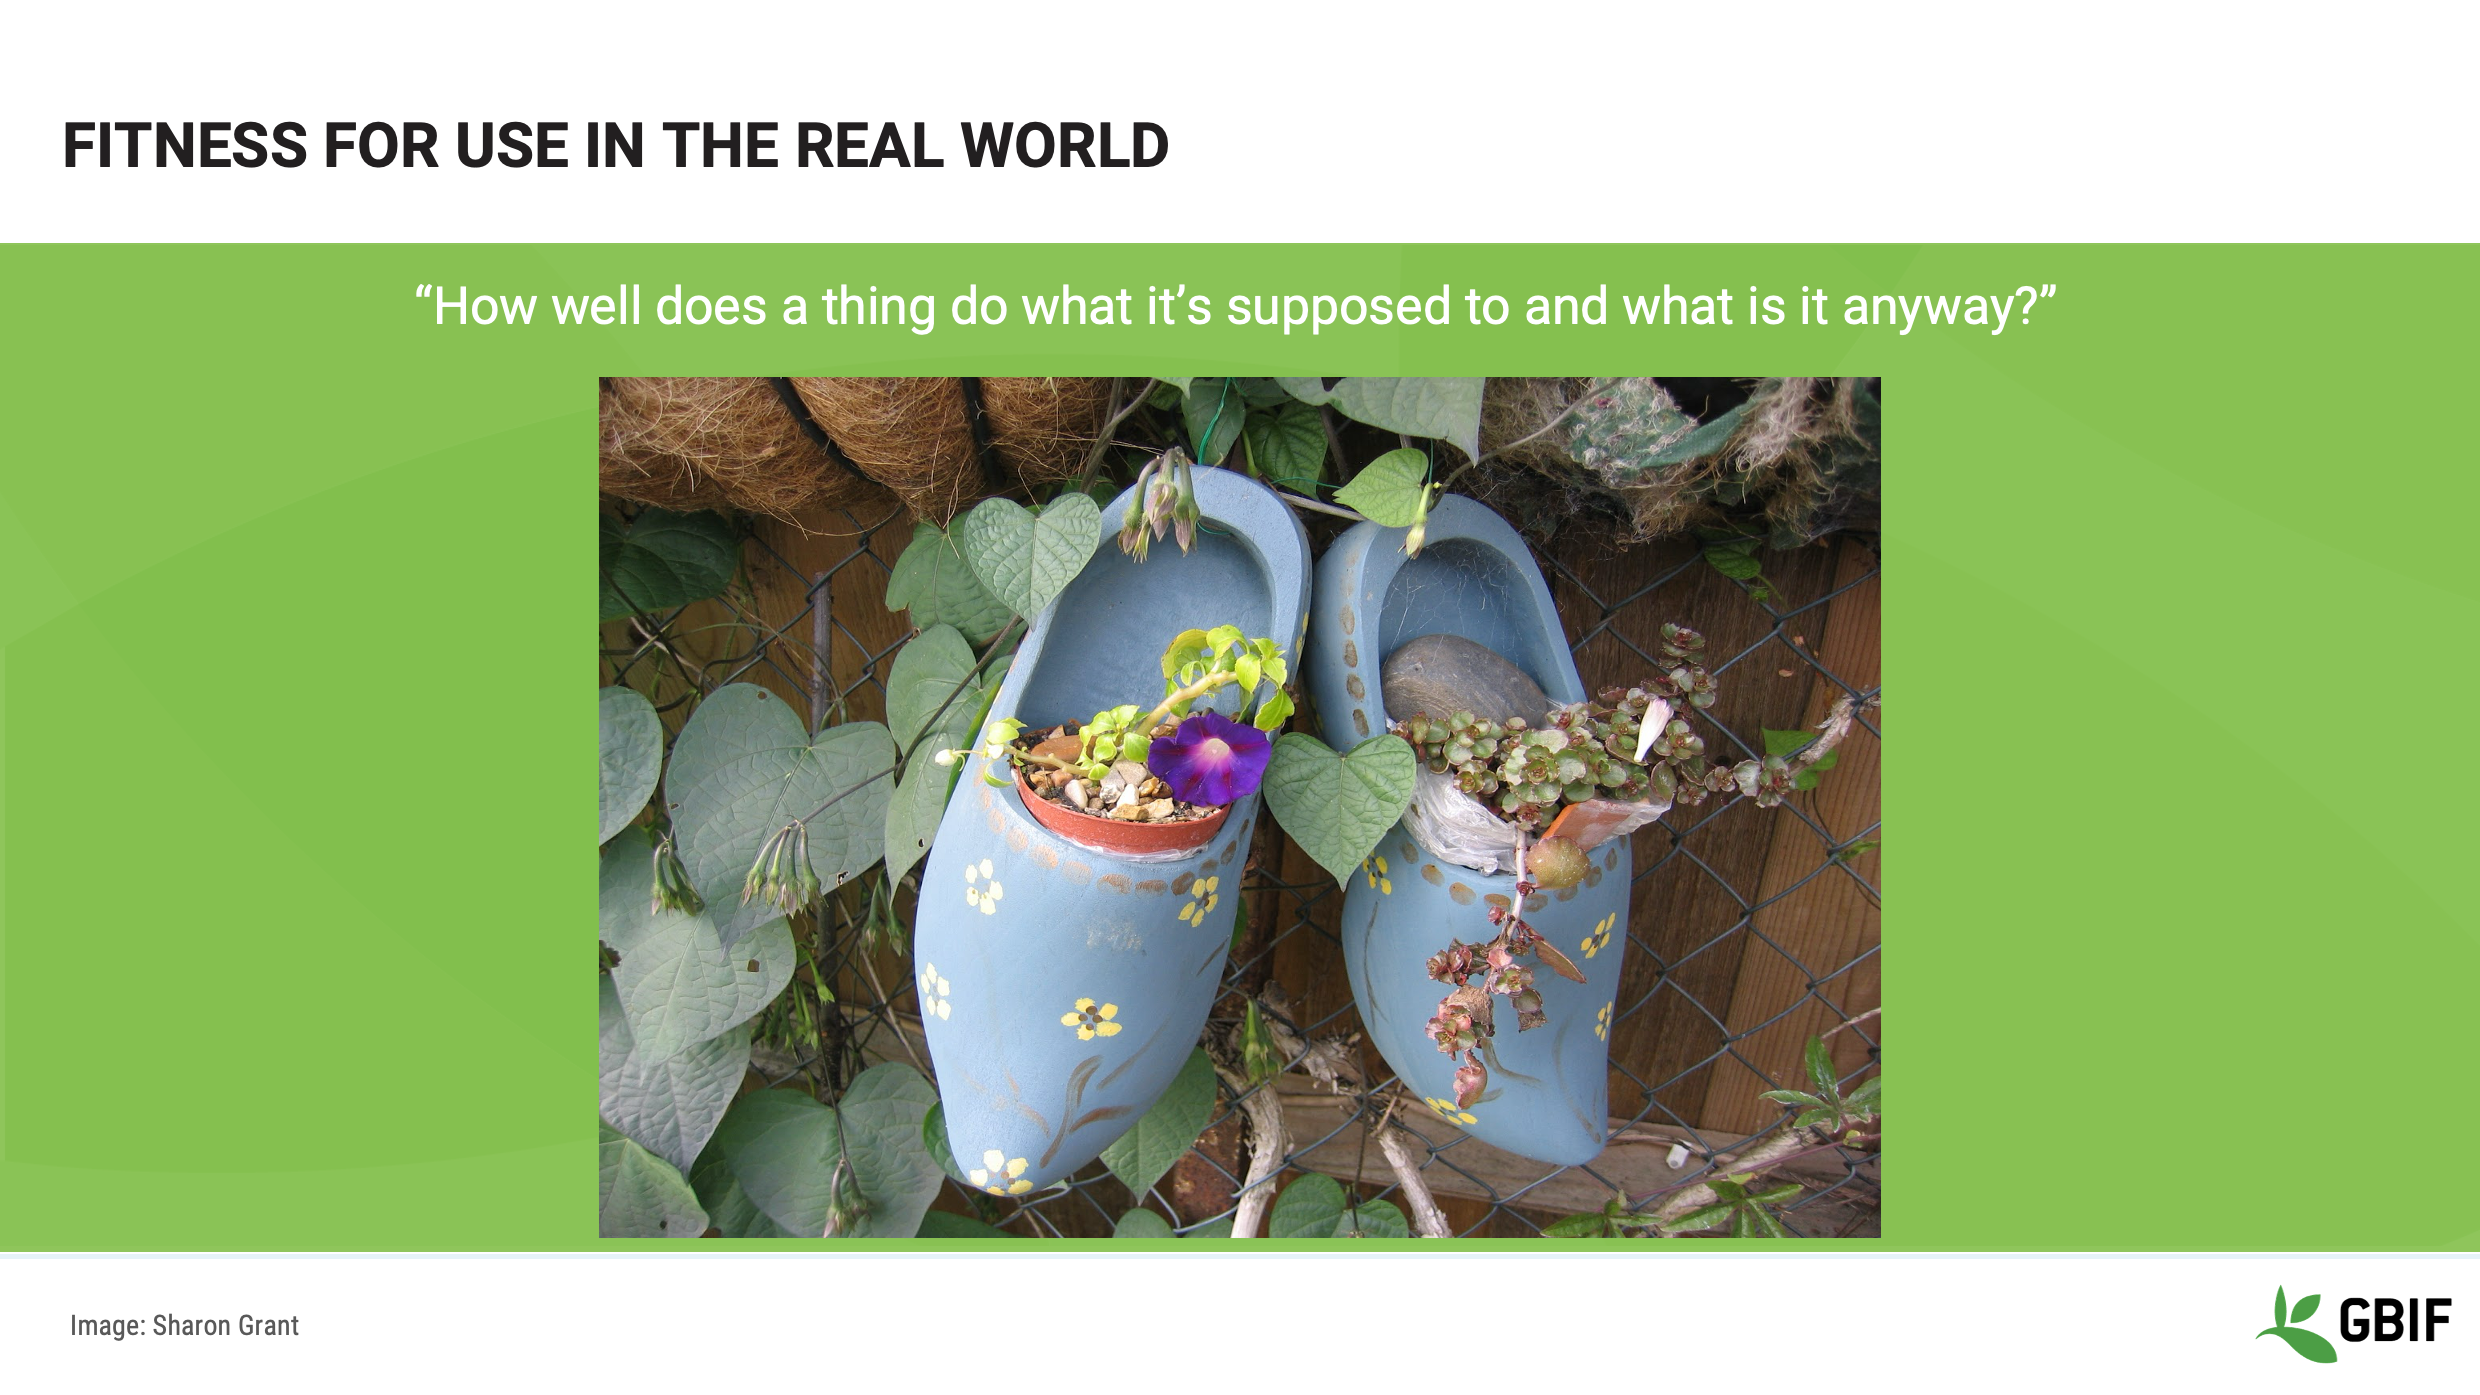
Slide 8 - Fitness for use in the real world
Do you think that the same shoemaker knew that a gardener might one day use the shoes as plant pots?
Maybe not.
Image Reference: Sharon Grant [https://www.flickr.com/photos/rondls_pics/4941594970/in/album-72157616943444786/]
Slide 9 - Fitness for use
We often hear people talk about data’s Fitness for Use in the ecological sciences, but what we need to remember is that data is not inherently good or bad. Rather it is the user of the data who gives data its value.
For example, for one person, data identified to the level of Genus may be sufficient to run predictive models of ecological niches. For a person studying a particular taxon, that same genus-level data will be much less useful than more detailed occurrences with subspecies information.
Photo: GBIF: https://www.gbif.org/occurrence/1621797237 Calotes mystaceus Duméril & Bibron, 1837 Rights holder: robbythai License: http://creativeco…censes/by-nc/4.0/ Reference: https://www.inatu…rg/photos/9949104
Slide 10 - Fitness for use
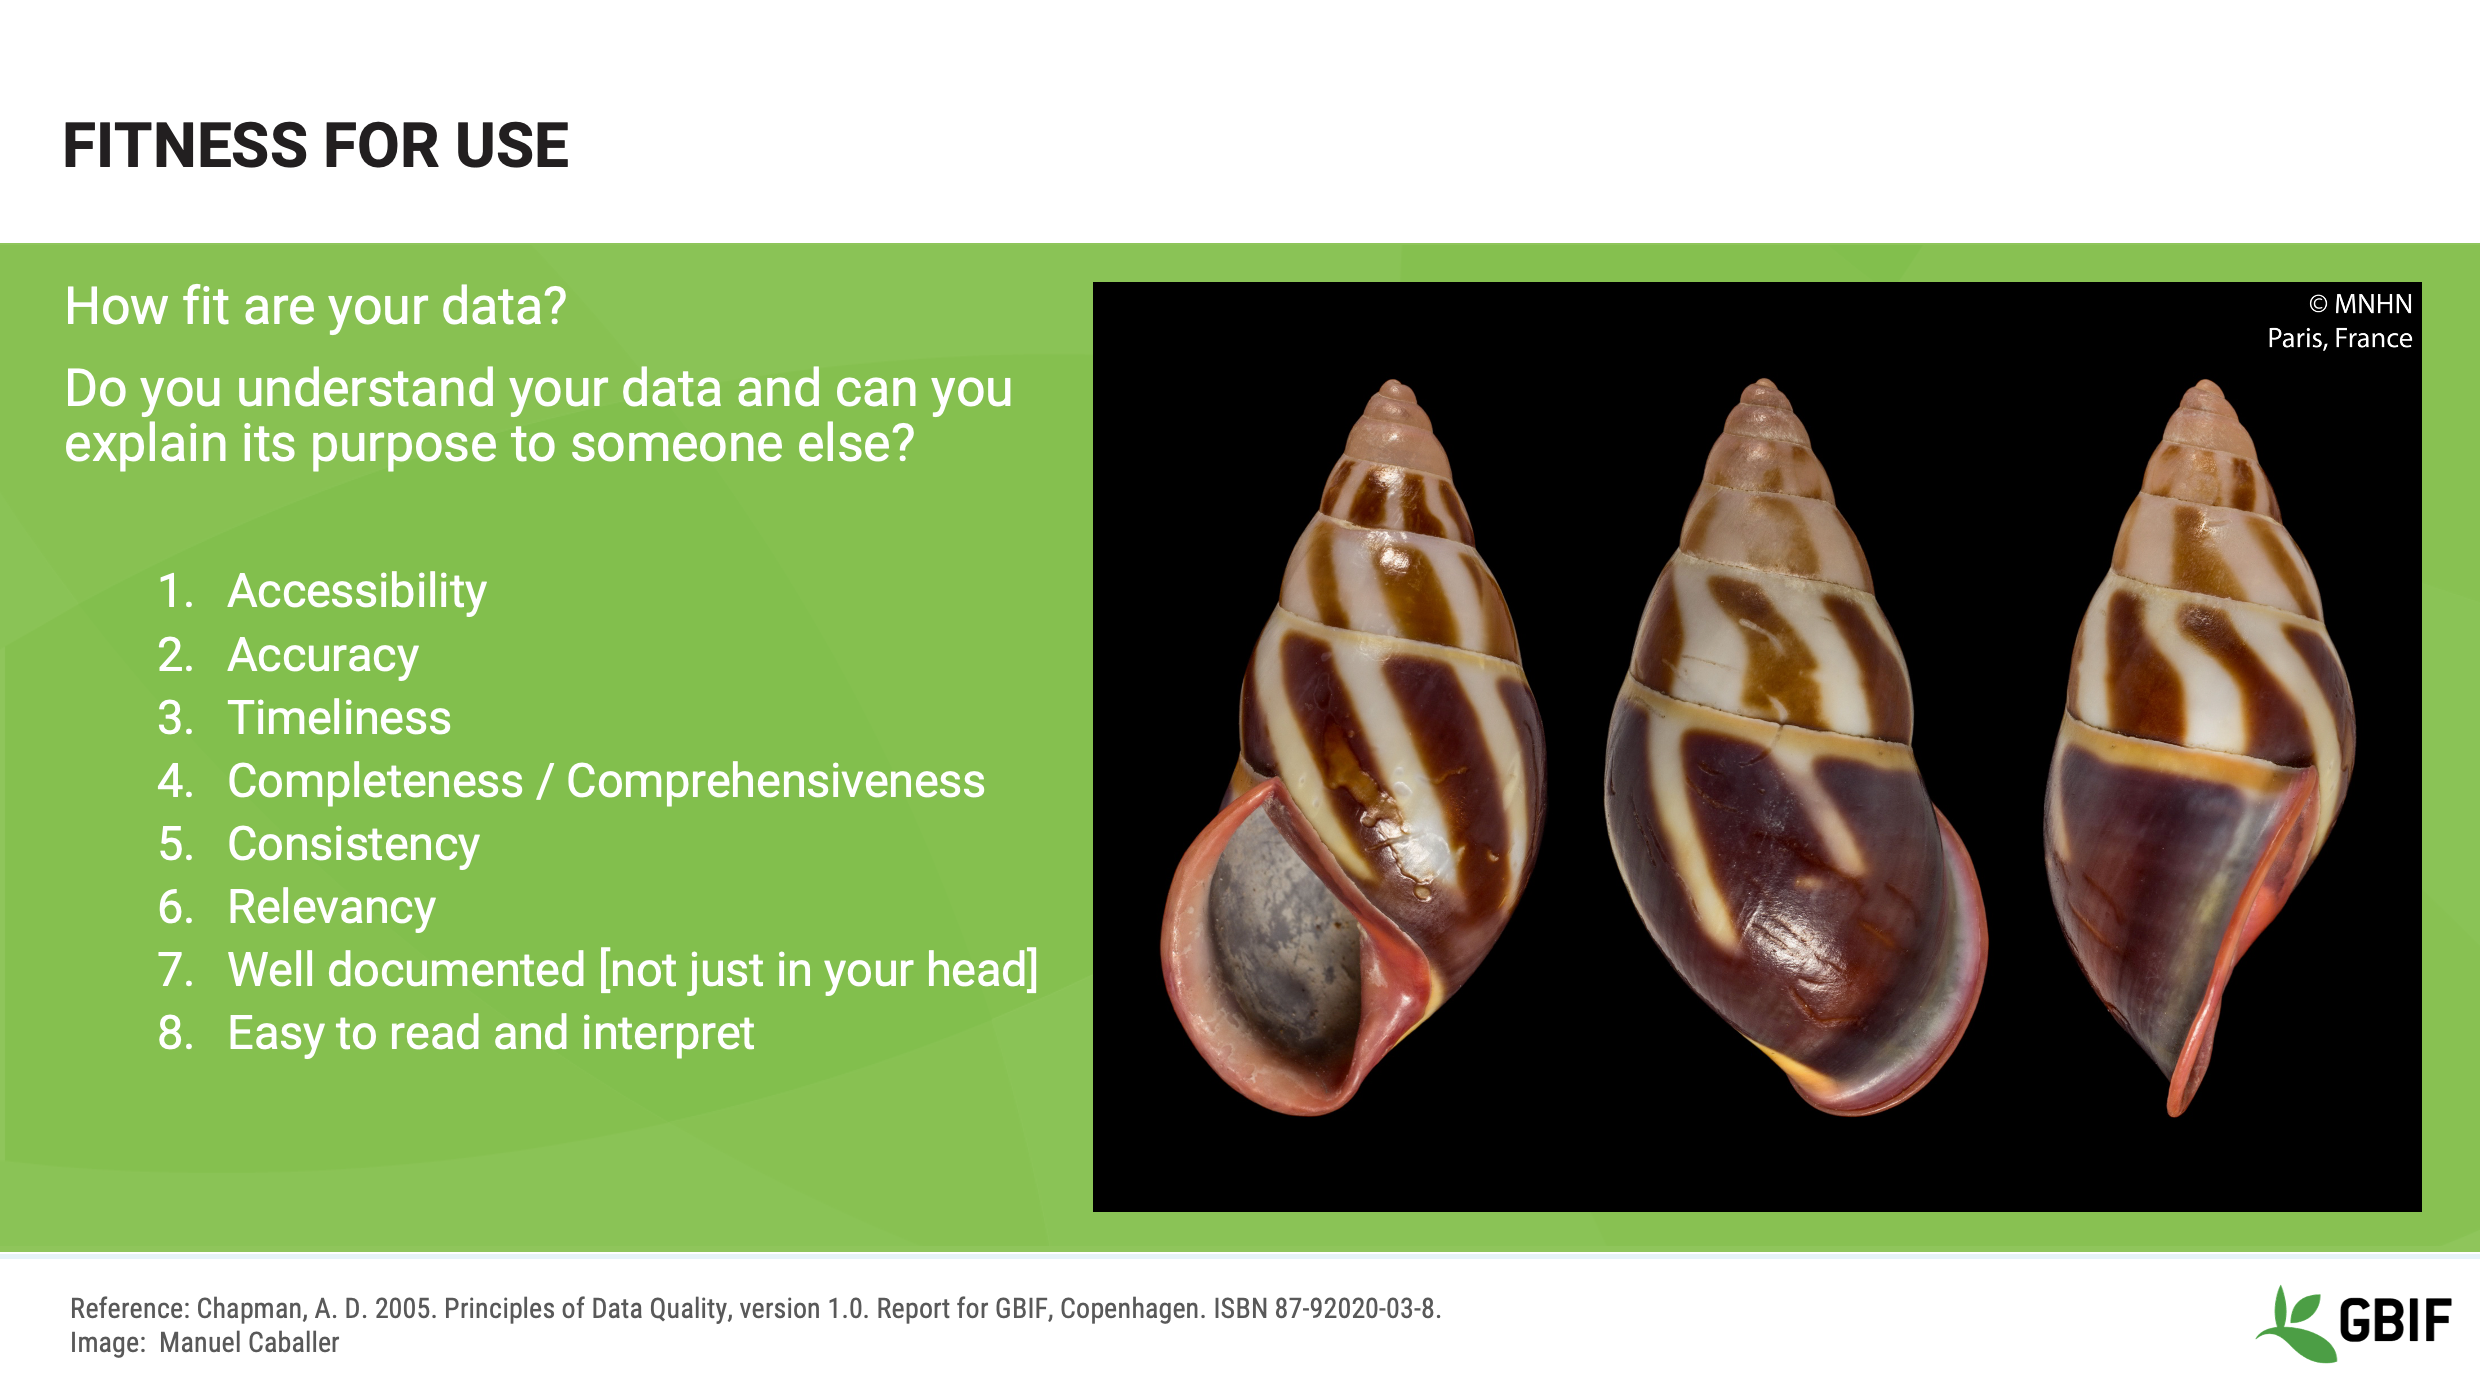
So, what is Fitness for Use and how does it relate to data?
When Chapman discusses Fitness for Use, he says that once a dataset has been created and shared there are two primary perspectives on how those data might be used; the perspective of the creator and the perspective of the user.
To help somebody to decide if your data is trustworthy or useful enough for them to use, you have to understand your data and how to convey those data to the potential user. These are some of the important questions about the metadata, or characteristics of your data, that you should be able to answer and share with others:
-
How Accessible are your data? How easily can someone access your data? People can’t use the data if they can’t find the data.
-
How Accurate are your data? Can your data be trusted? For example, are your identifications current and were they made by known experts?
-
How Timely are they? When will the data be made available? How often are they updated?
-
How Complete or Comprehensive are the data? Which parts of your dataset are documented fully? How well do the data cover a particular time, place, or domain?
-
How Consistent are they? Is the data in each field always of the same type? Was the data collected using the same documented protocols?
-
How Relevant are they? How similar is this dataset to others that have been used successfully for the same purpose?
-
How Detailed are the data? How much resolution is there in your data? At what scale can they be used for mapping?
-
Is the data Easy to interpret? Is the dataset documented in a clear and concise way? If your documents are handwritten, are they legible?
Photo: GBIF: https://www.gbif.org/occurrence/1932569869 Amphidromus goldbergi Thach & F. Huber, 2018 Rights holder: Manual Caballer License: http://creativeco…/licenses/by/4.0/ Identifier: https://mediaphoto.mnhn.fr/media/1546617441086USKcRv3tfQkB8mZo
Slide 11 - Measures of quality
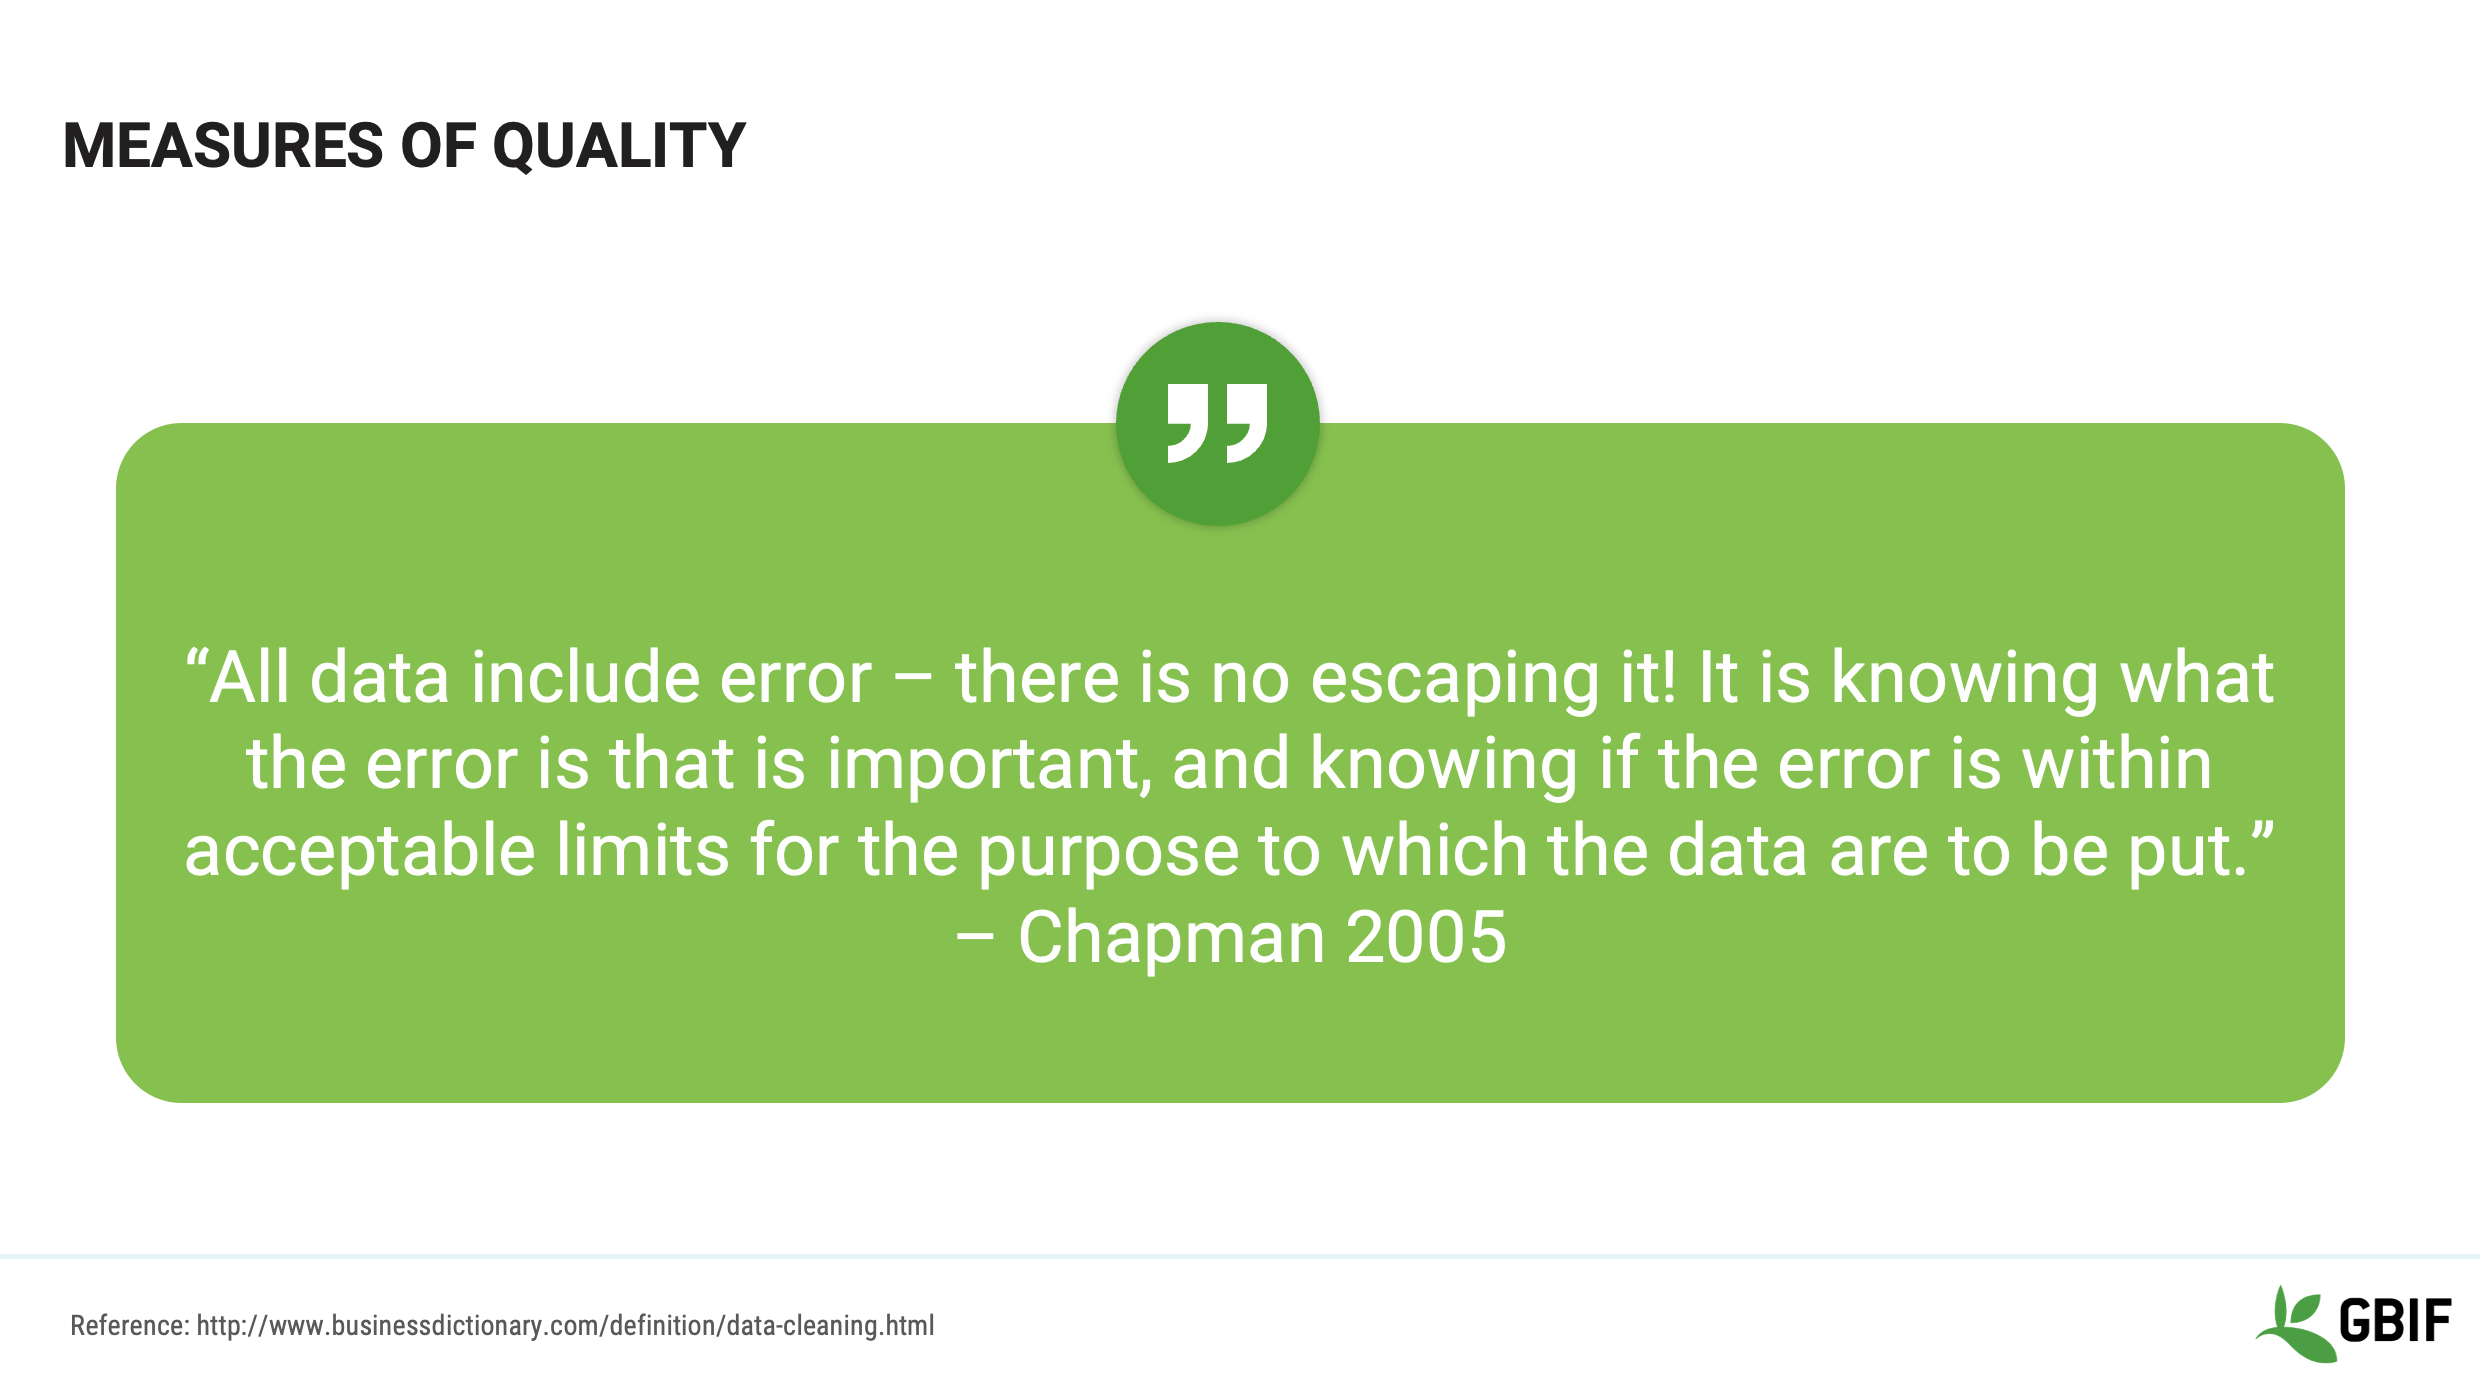
While Fitness for Use is subjective, measures of data quality are much less so. Chapman states that:
"All data include error – there is no escaping it! It is knowing what the error is that is important, and knowing if the error is within acceptable limits for the purpose to which the data are to be put. (Chapman 2005)”
Slide 12 - Measures of quality
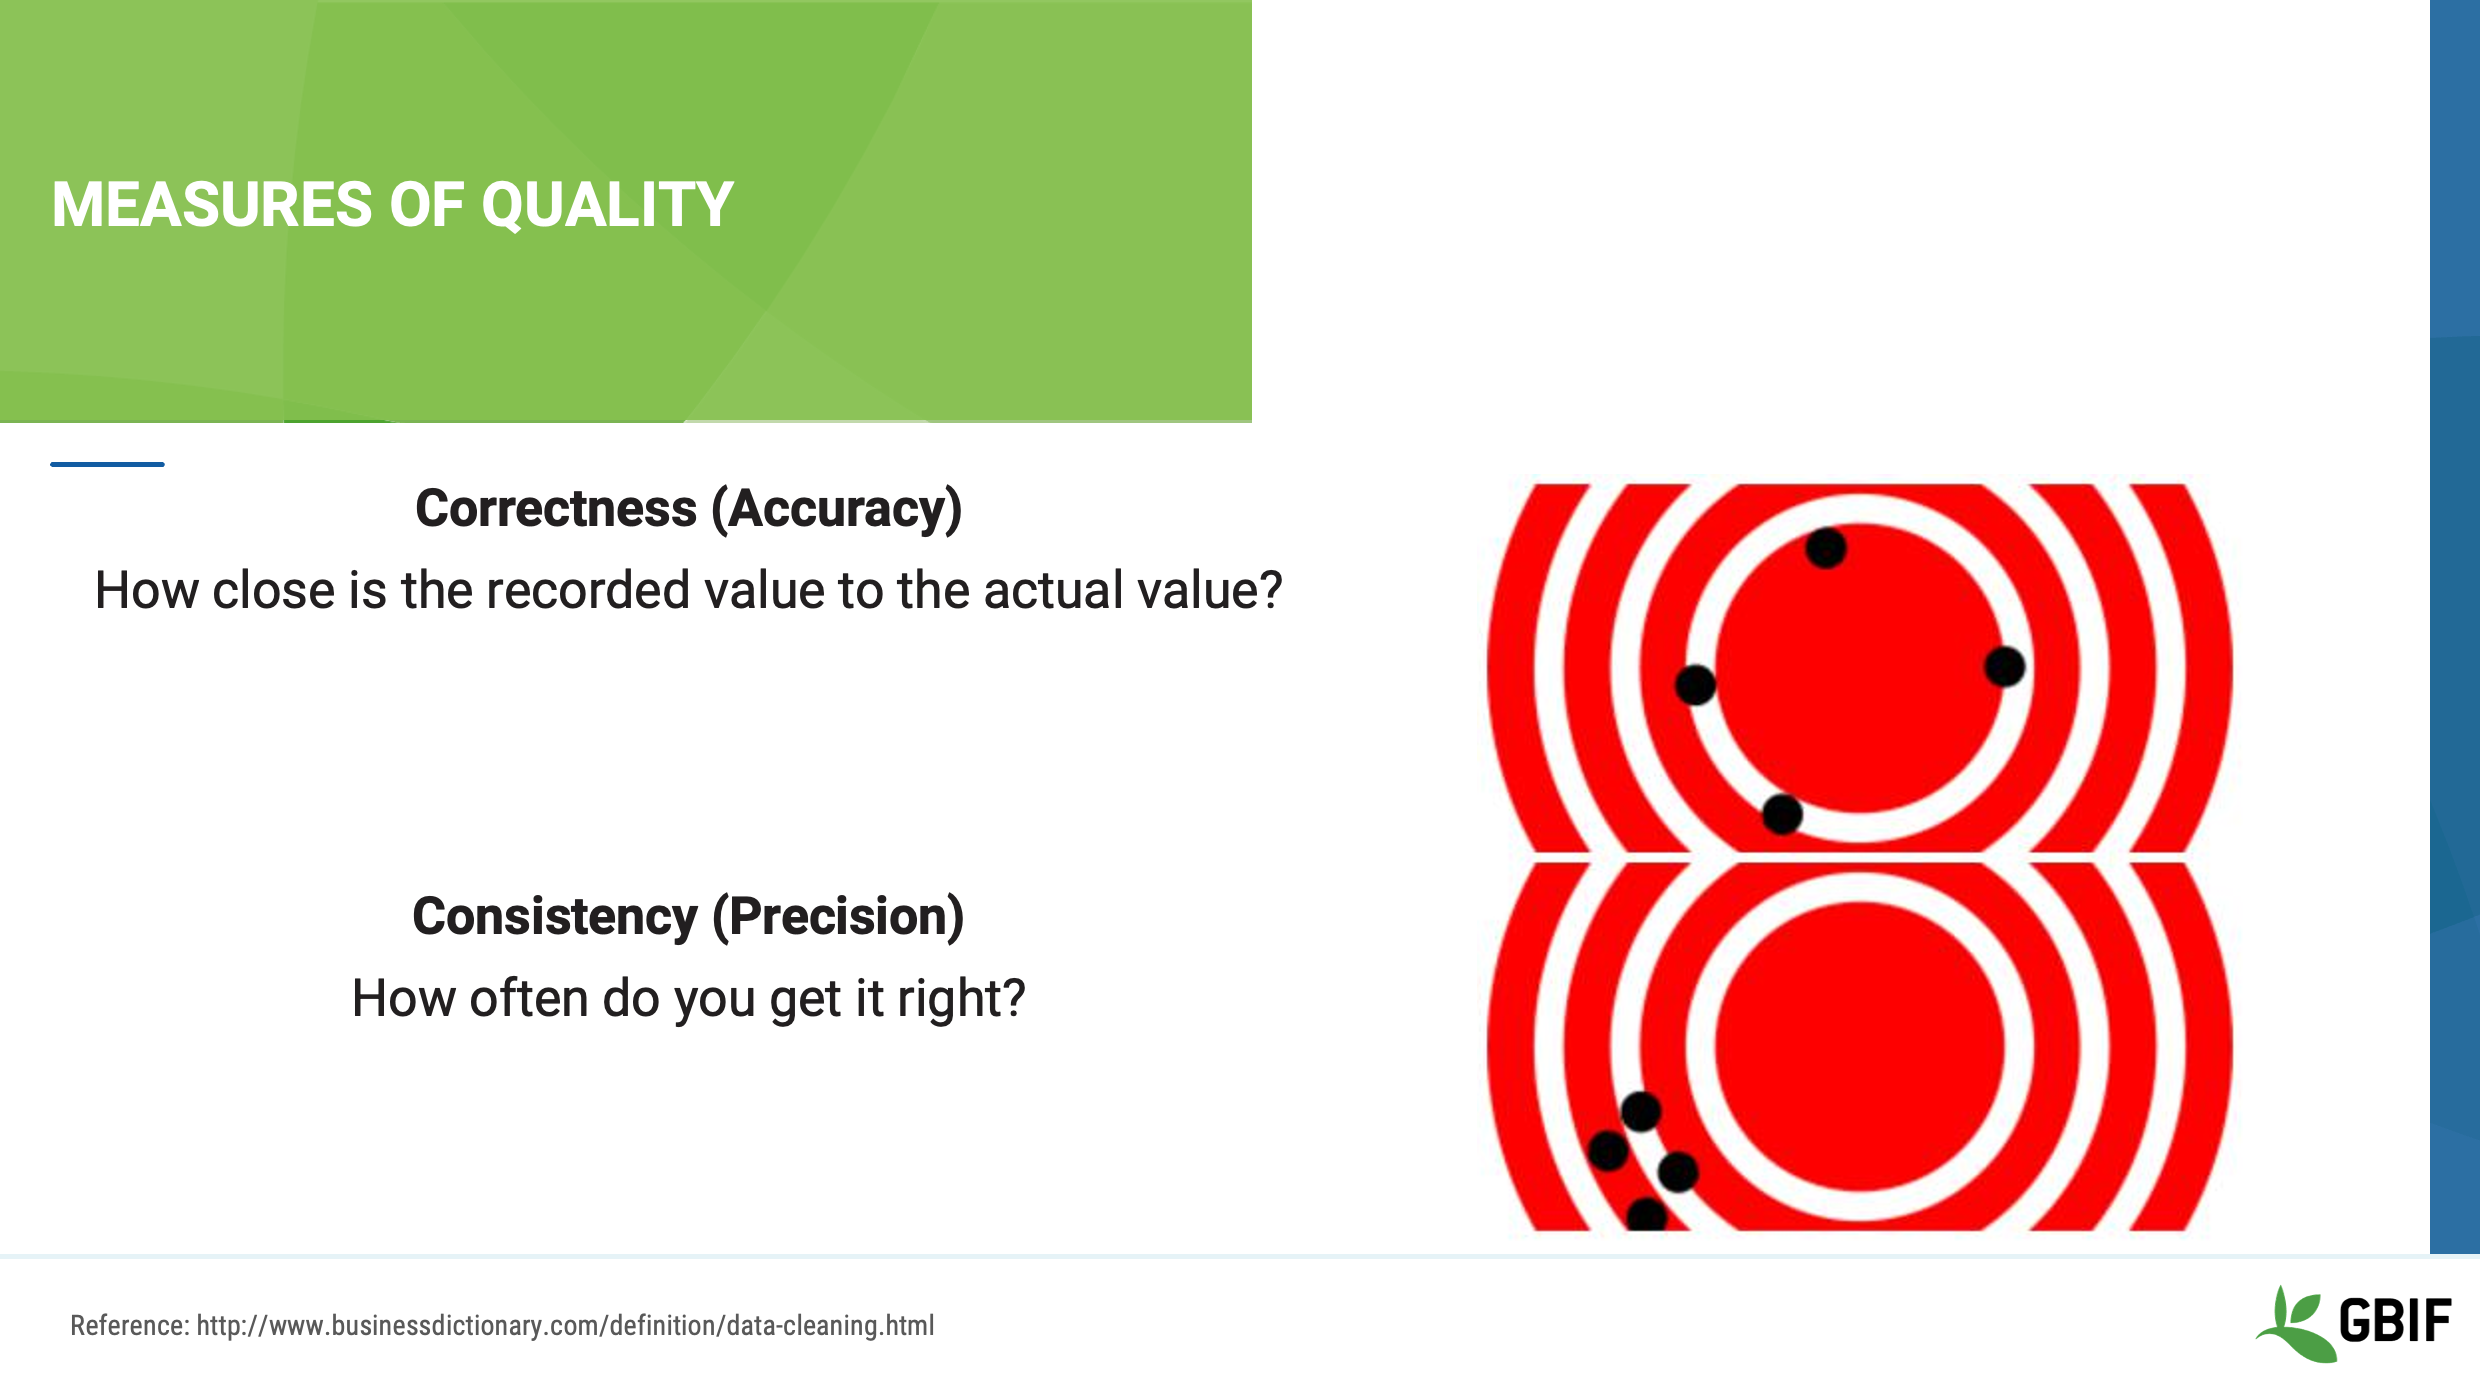
We can use two measures of quality, Correctness and Consistency, to help us to document these inherent errors in data.
Correctness, sometimes called accuracy, is “How close the recorded value is to the actual, real-world value”.
In this diagram accuracy is how close a given dot is to the centre of the target.
Consistency, sometimes called precision, is “How often you get it right”
In this diagram, precision is how close the dots are together irrespective of how close they are to the centre of the target.
These are measures of how well the data gatherer was able to capture the true value being investigated. Knowing these properties of your data will help you to understand the ways in which you can and cannot clean, validate and process the data.
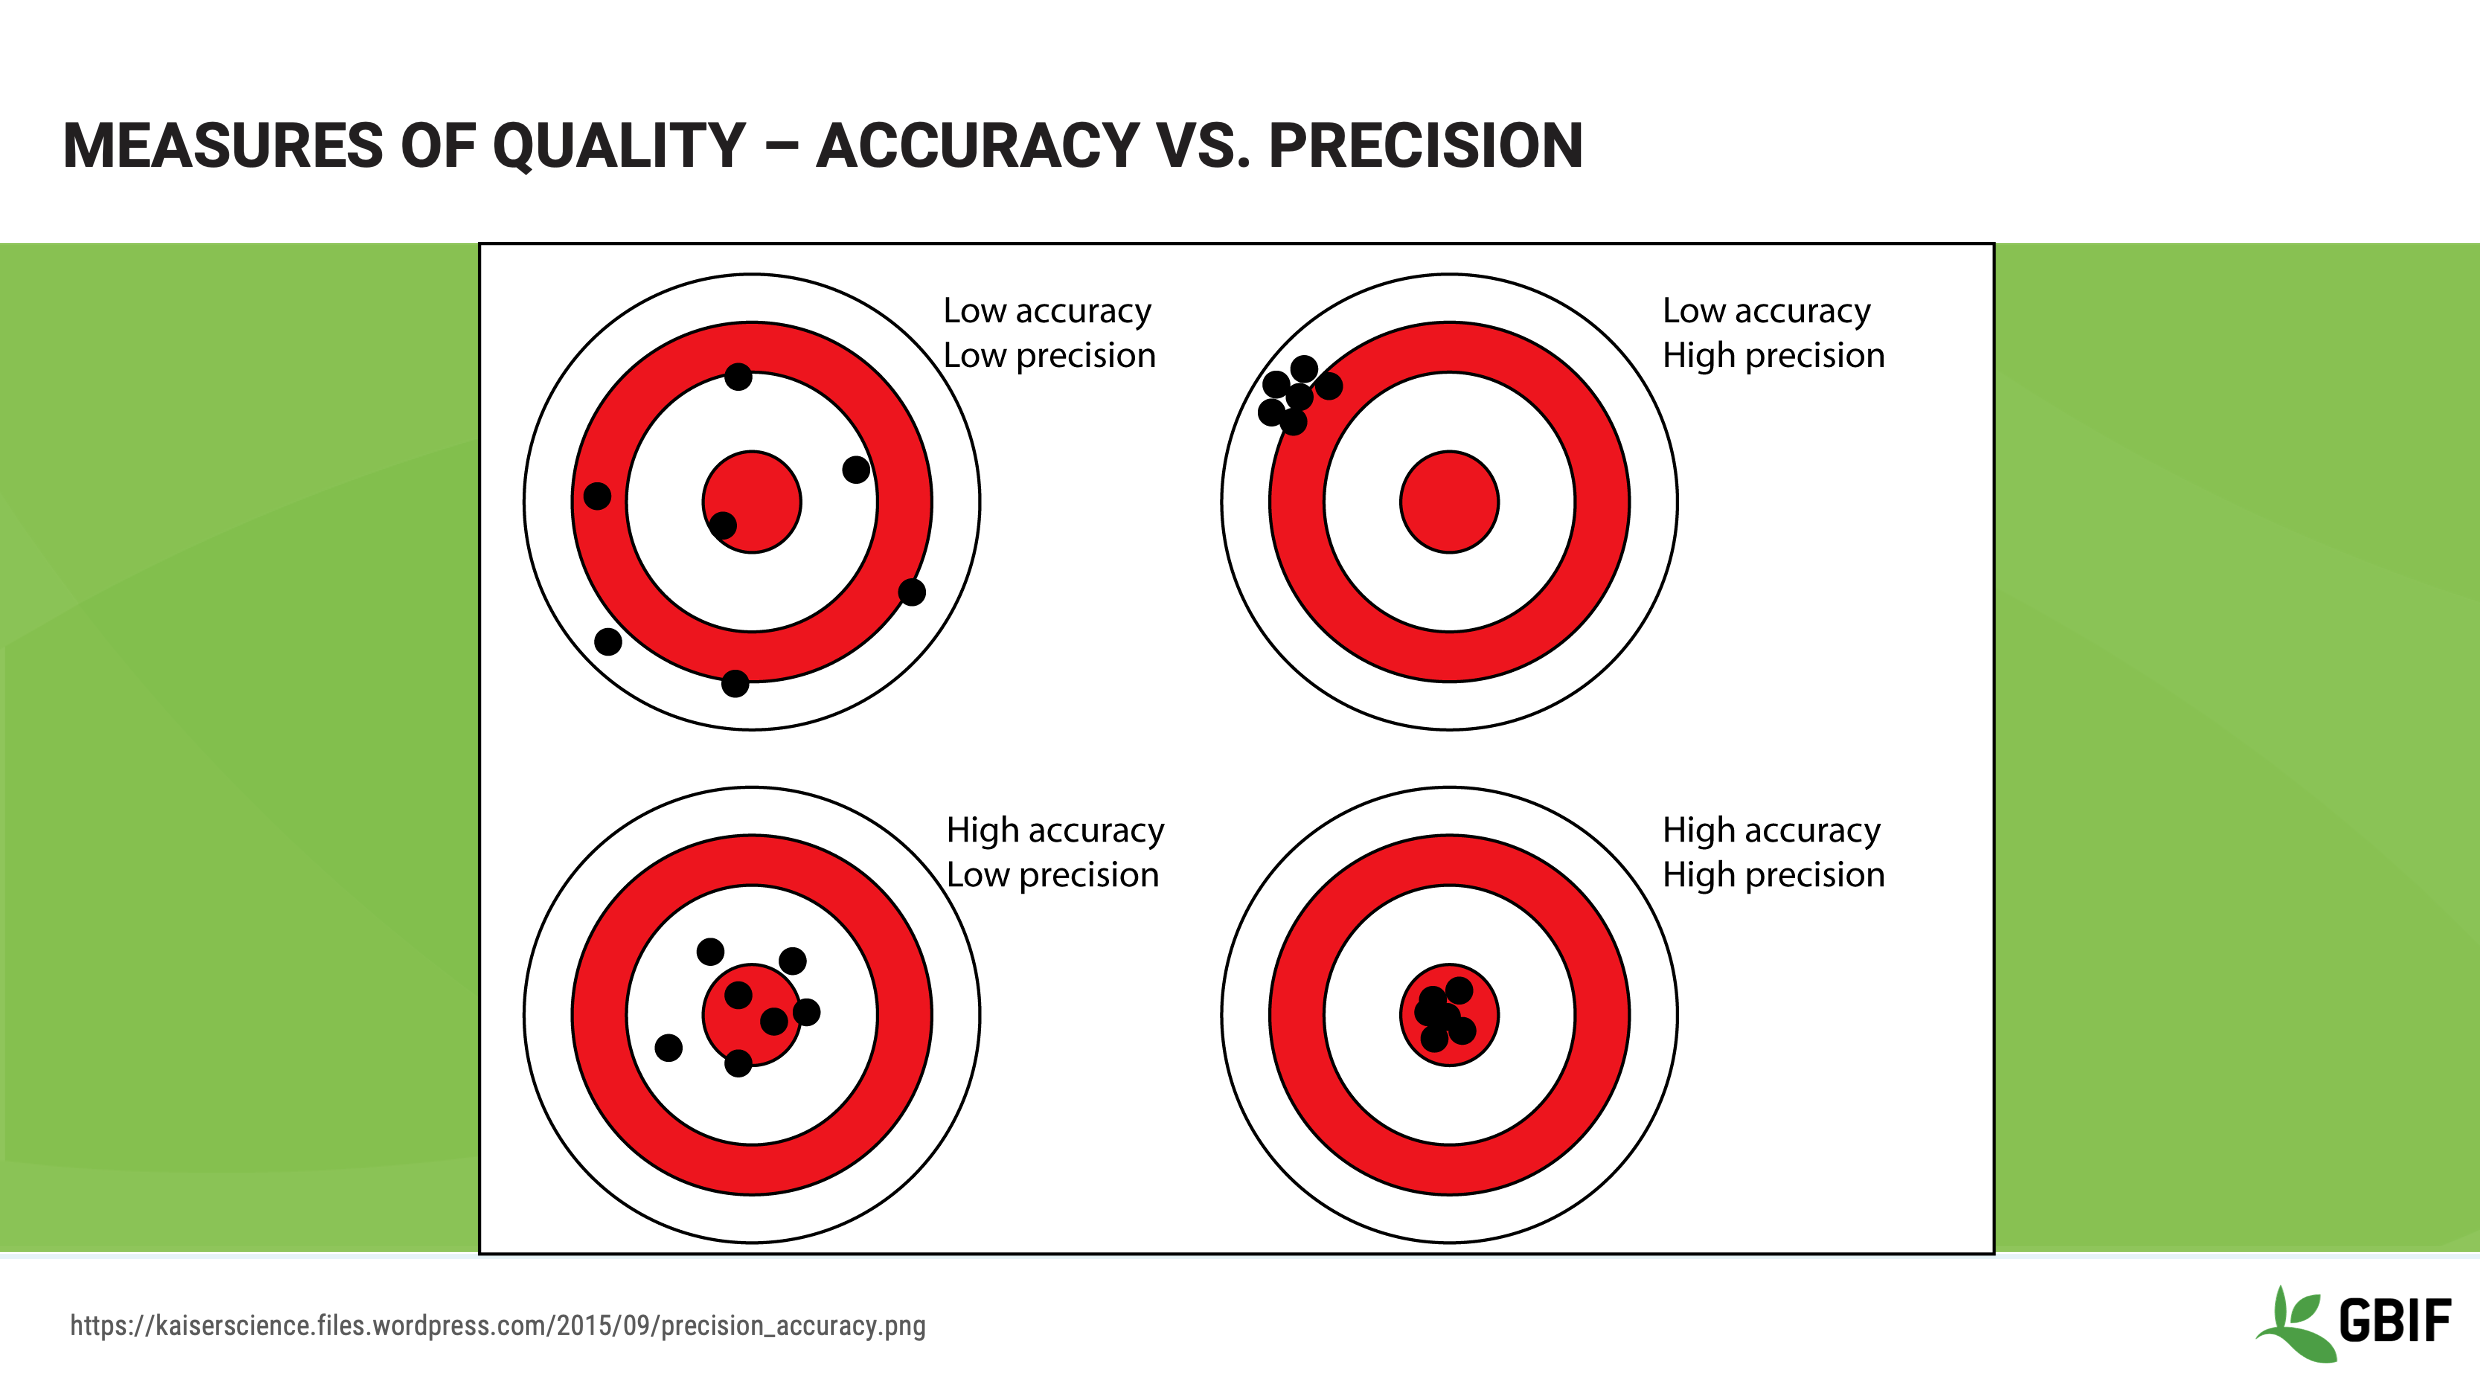
Slide 13 - Measures of quality - Accuracy vs precision
This image provides a clear set of illustrations of accuracy and precision. This may be a good image to keep with you when you have to explain these concepts to others.

Slide 14 - Measures of quality correctness
Let’s look at some examples of Correctness, or accuracy, and how it can help us think about the practicalities of data cleaning. Remember that Correctness is how close you are to the center of a target.
Let’s look at an example.
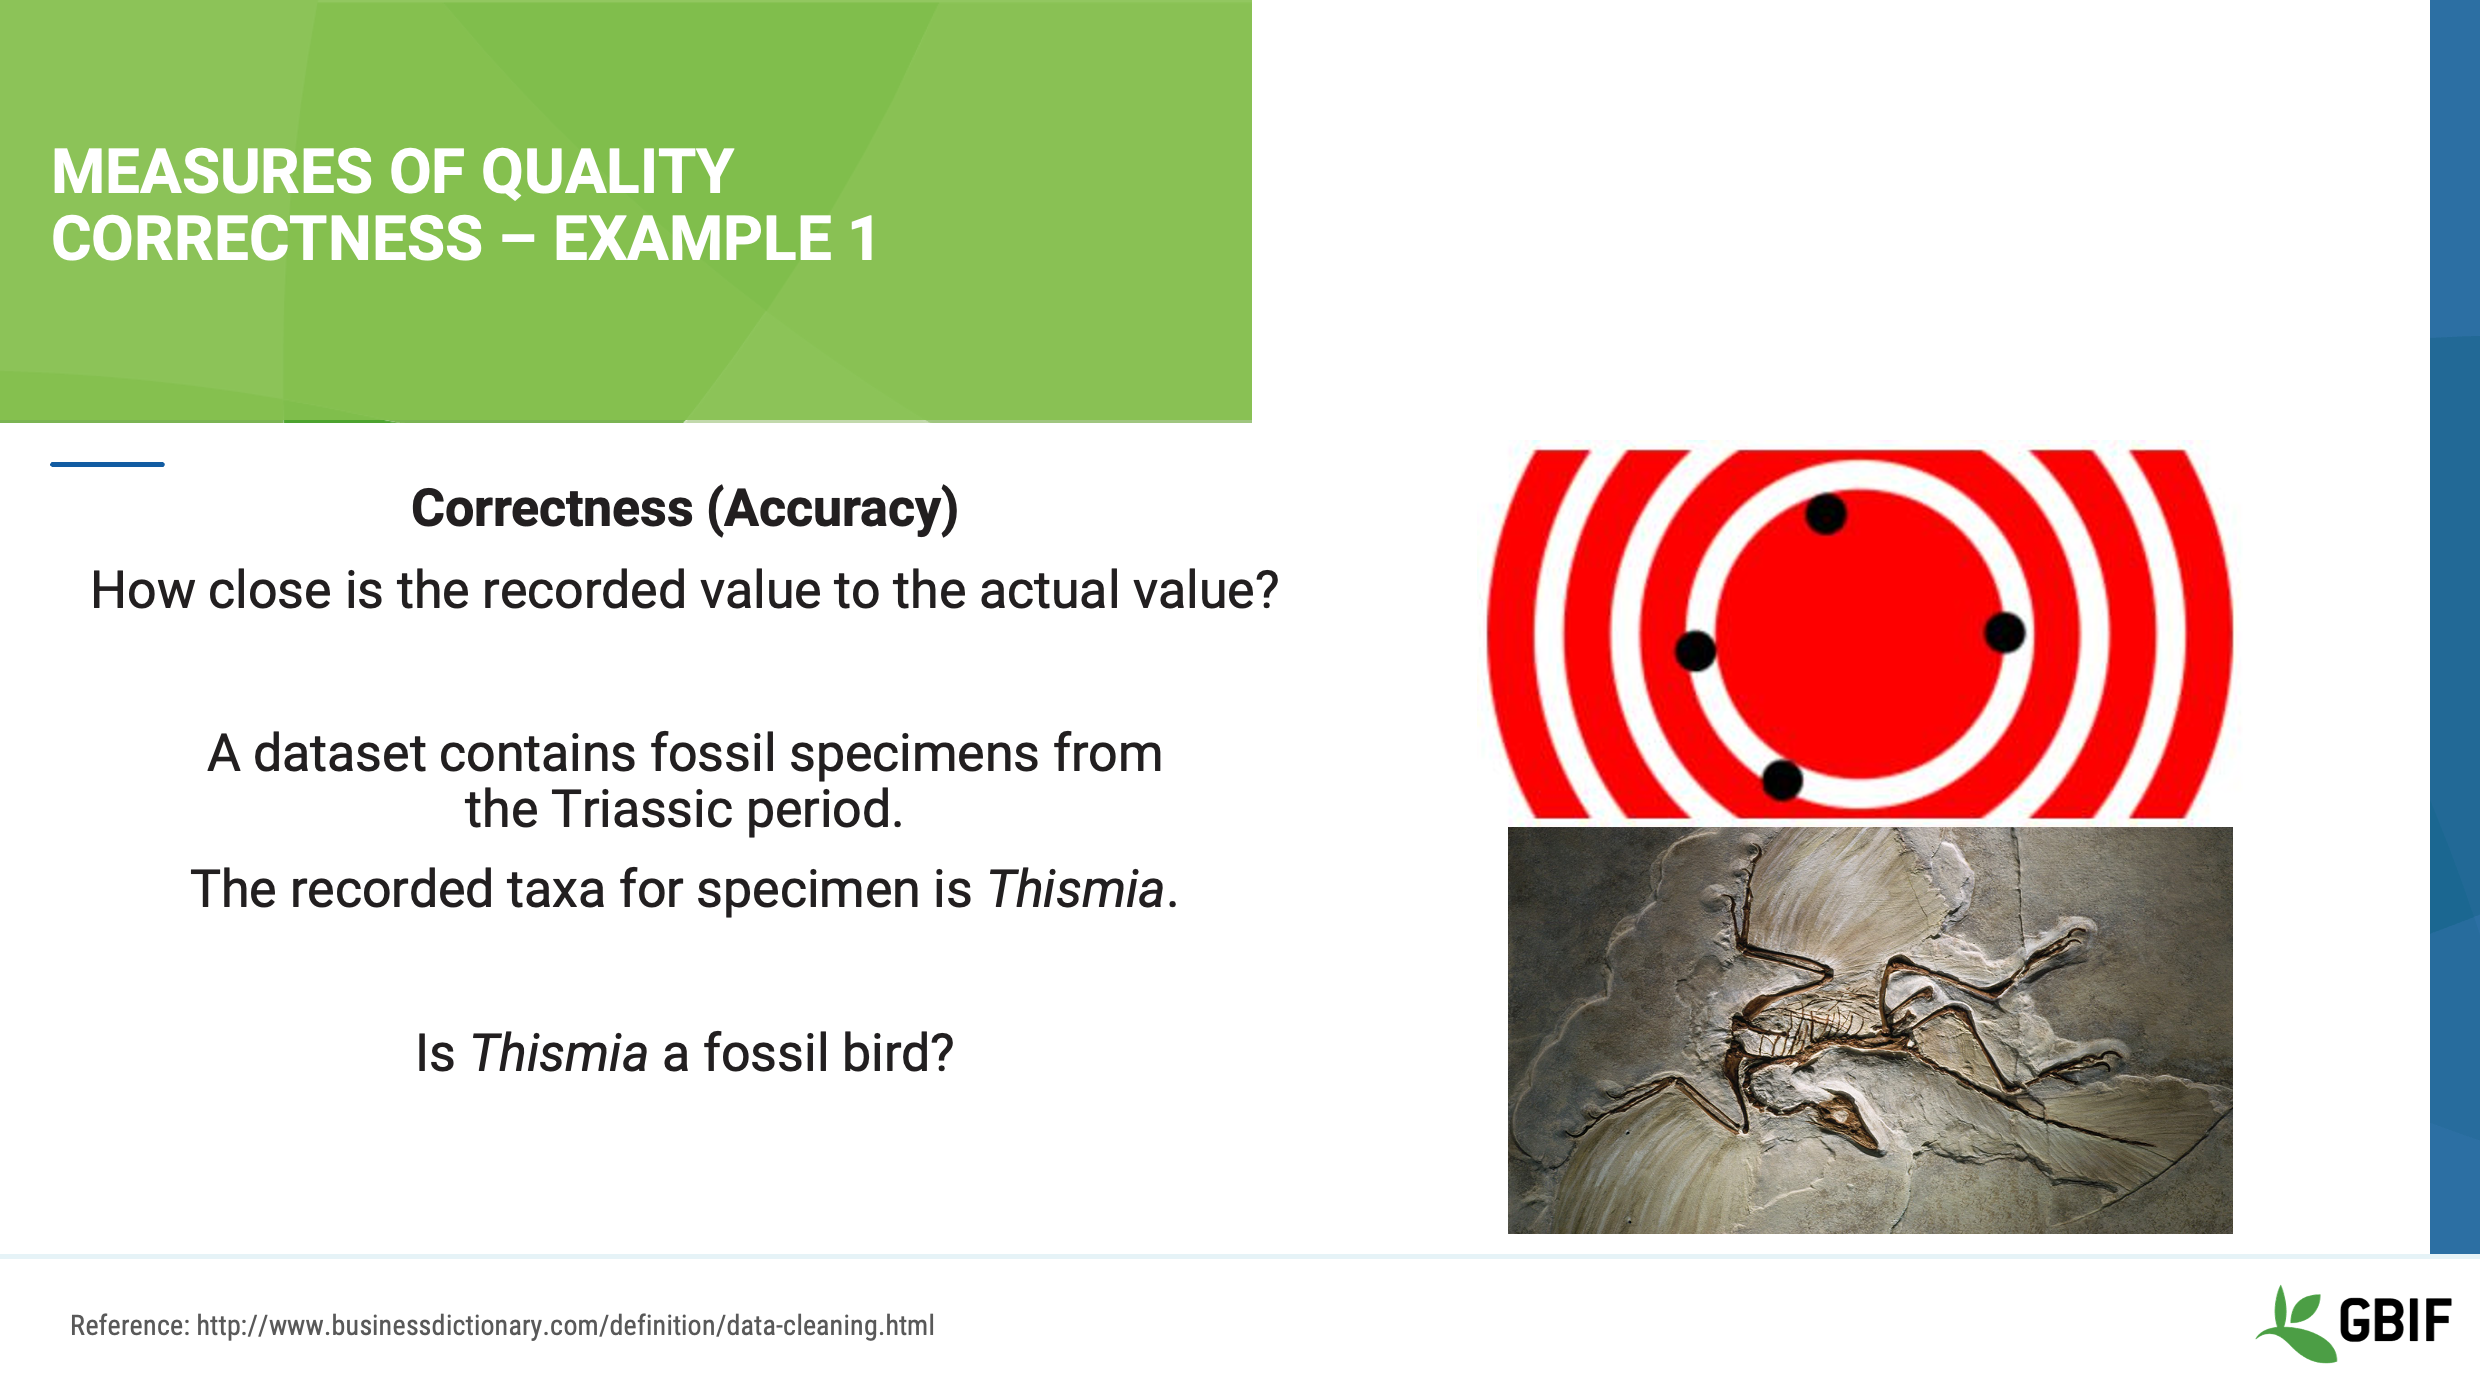
Slide 15 - Measures of quality correctness - Example 1
For this example let’s imagine your dataset contains records of fossil bird specimens from the Early Triassic Period. The taxonomic name for a number of specimens in your dataset is recorded as Thismia.
Do you know if Thismia is a taxon of ancient birds?
Image reference: https://commons.wikimedia.org/wiki/File:Archaeopteryx_fossil.jpg
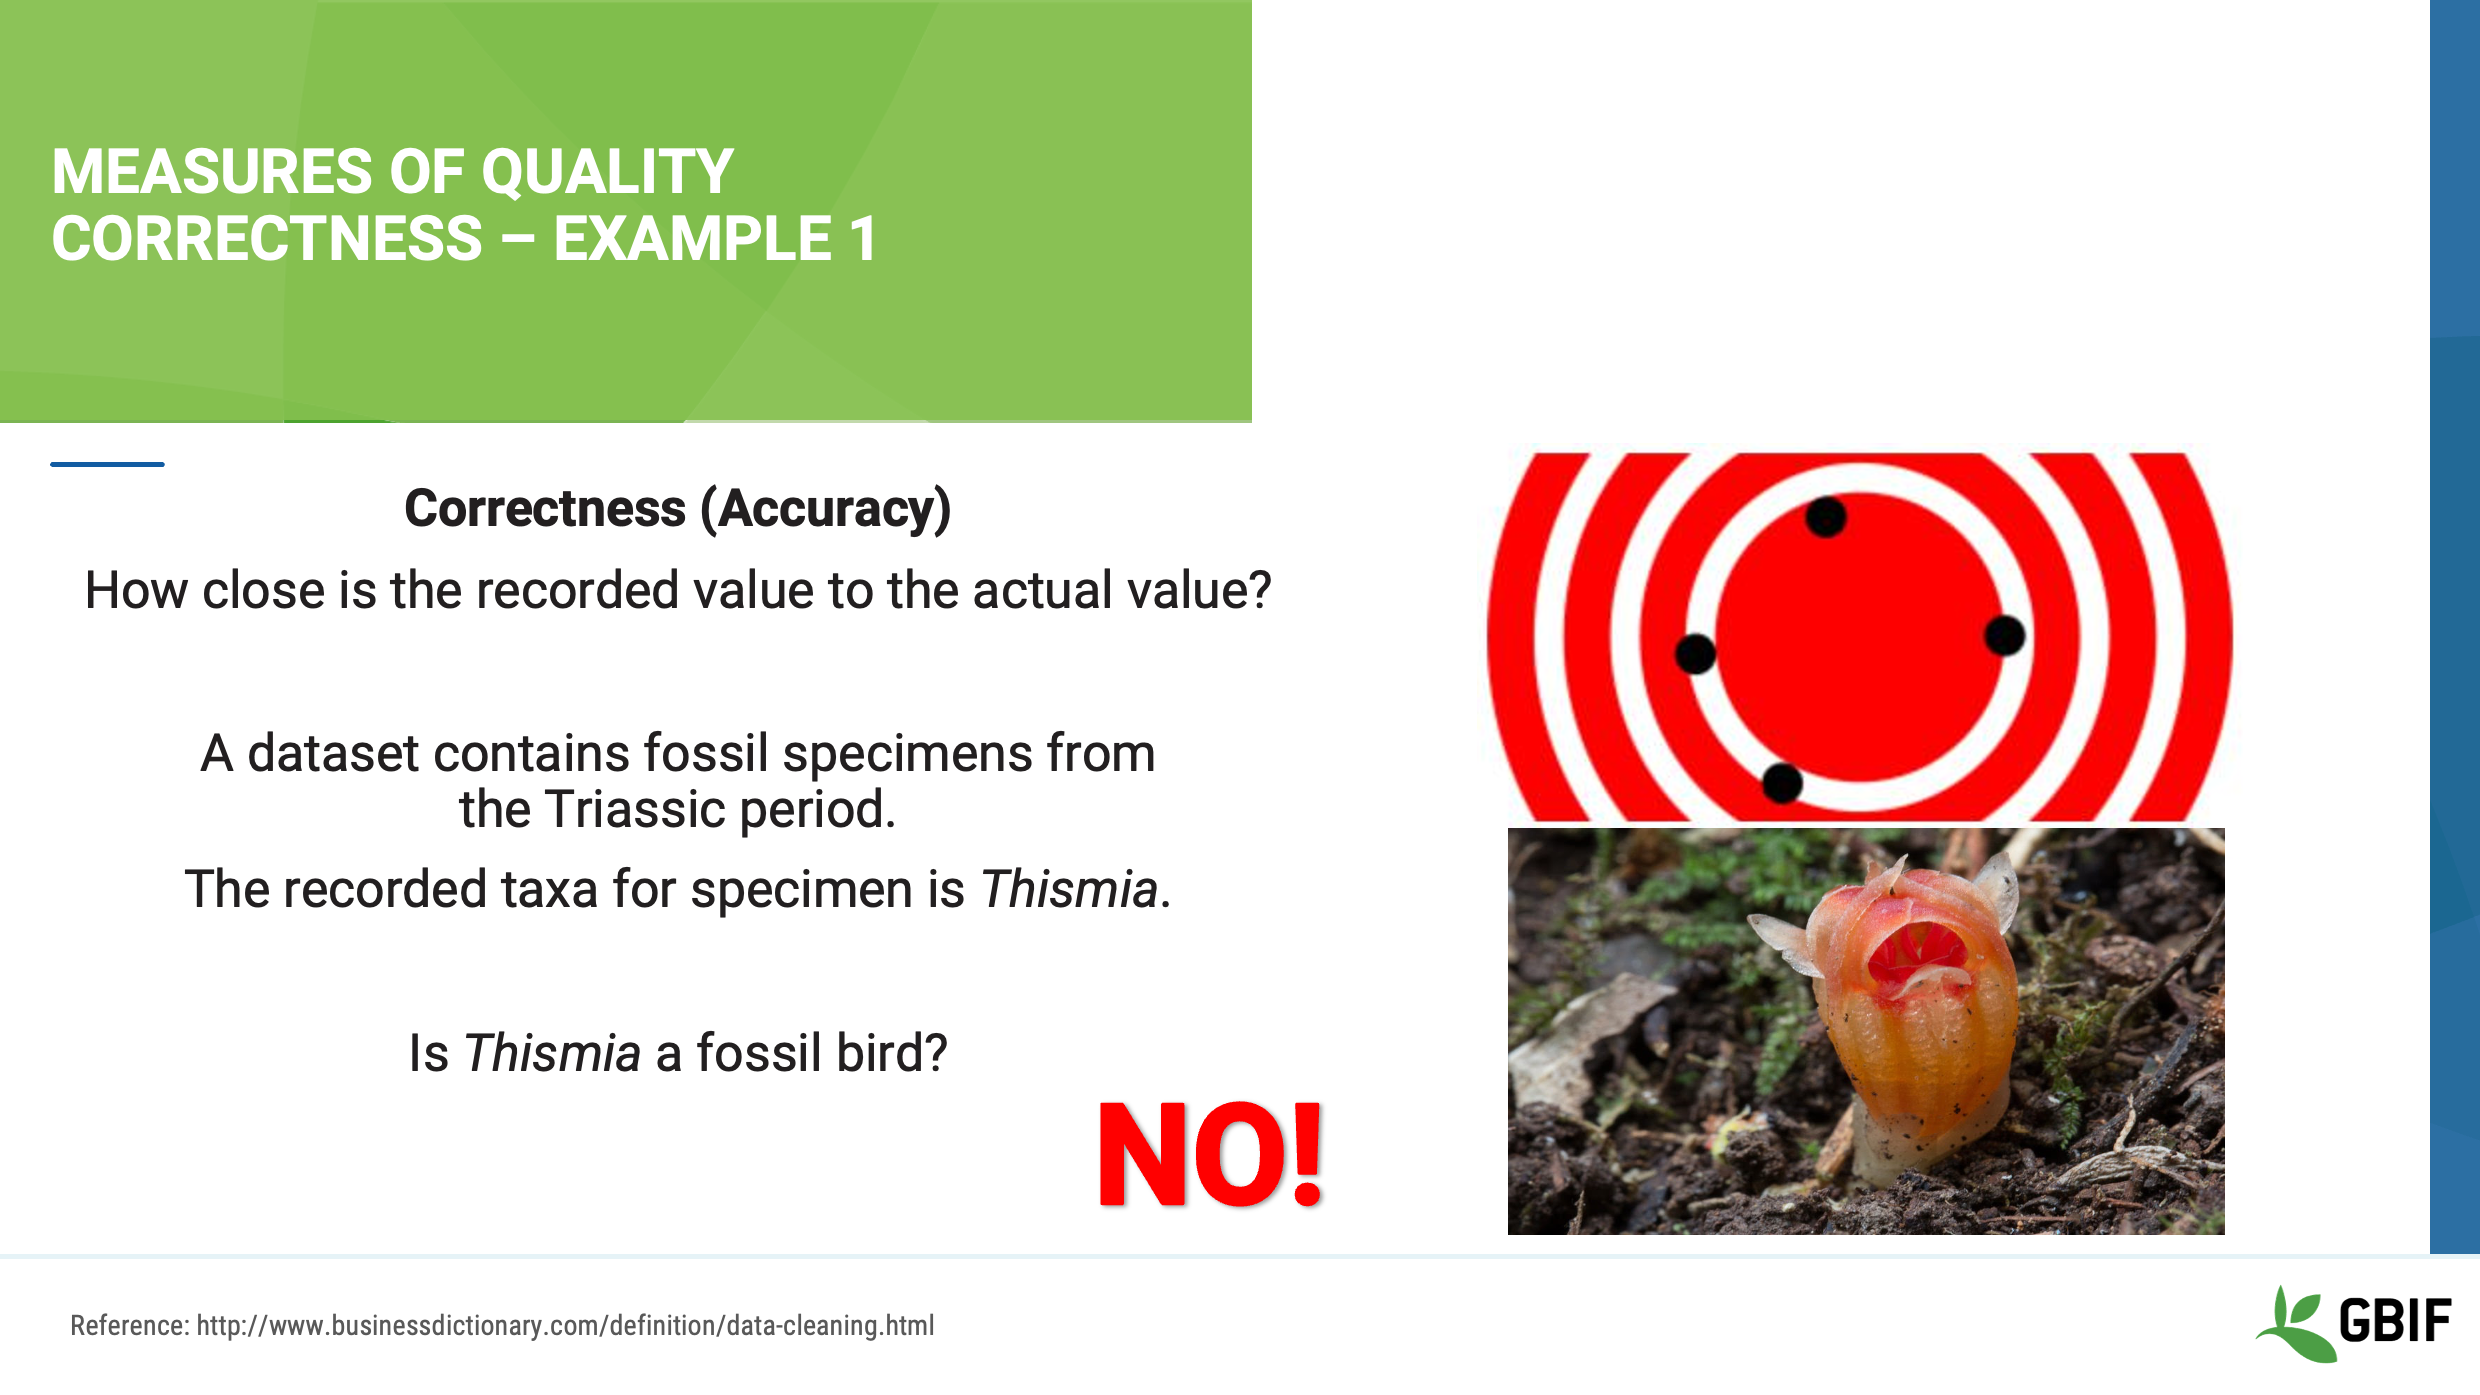
Slide 16 - Measures of quality correctness - Example 1
In this case, the answer is no!
Thismia is a very rare plant from the State of Illinois in the United States.
As a result, the correctness, or accuracy, of the taxonomic name is low. Perhaps because the data entry technician was not a paleontologist. As a result, all of the names in the dataset might need to be checked and corrected by an expert before the data could be used.
Photo: GBIF: (n/a) Thismia rodwayi Rights holder: Tindo2 License: http://creativeco…censes/by-nc/4.0/ Reference(n/a): https://www.inaturalist.org/photos/596775?size=large
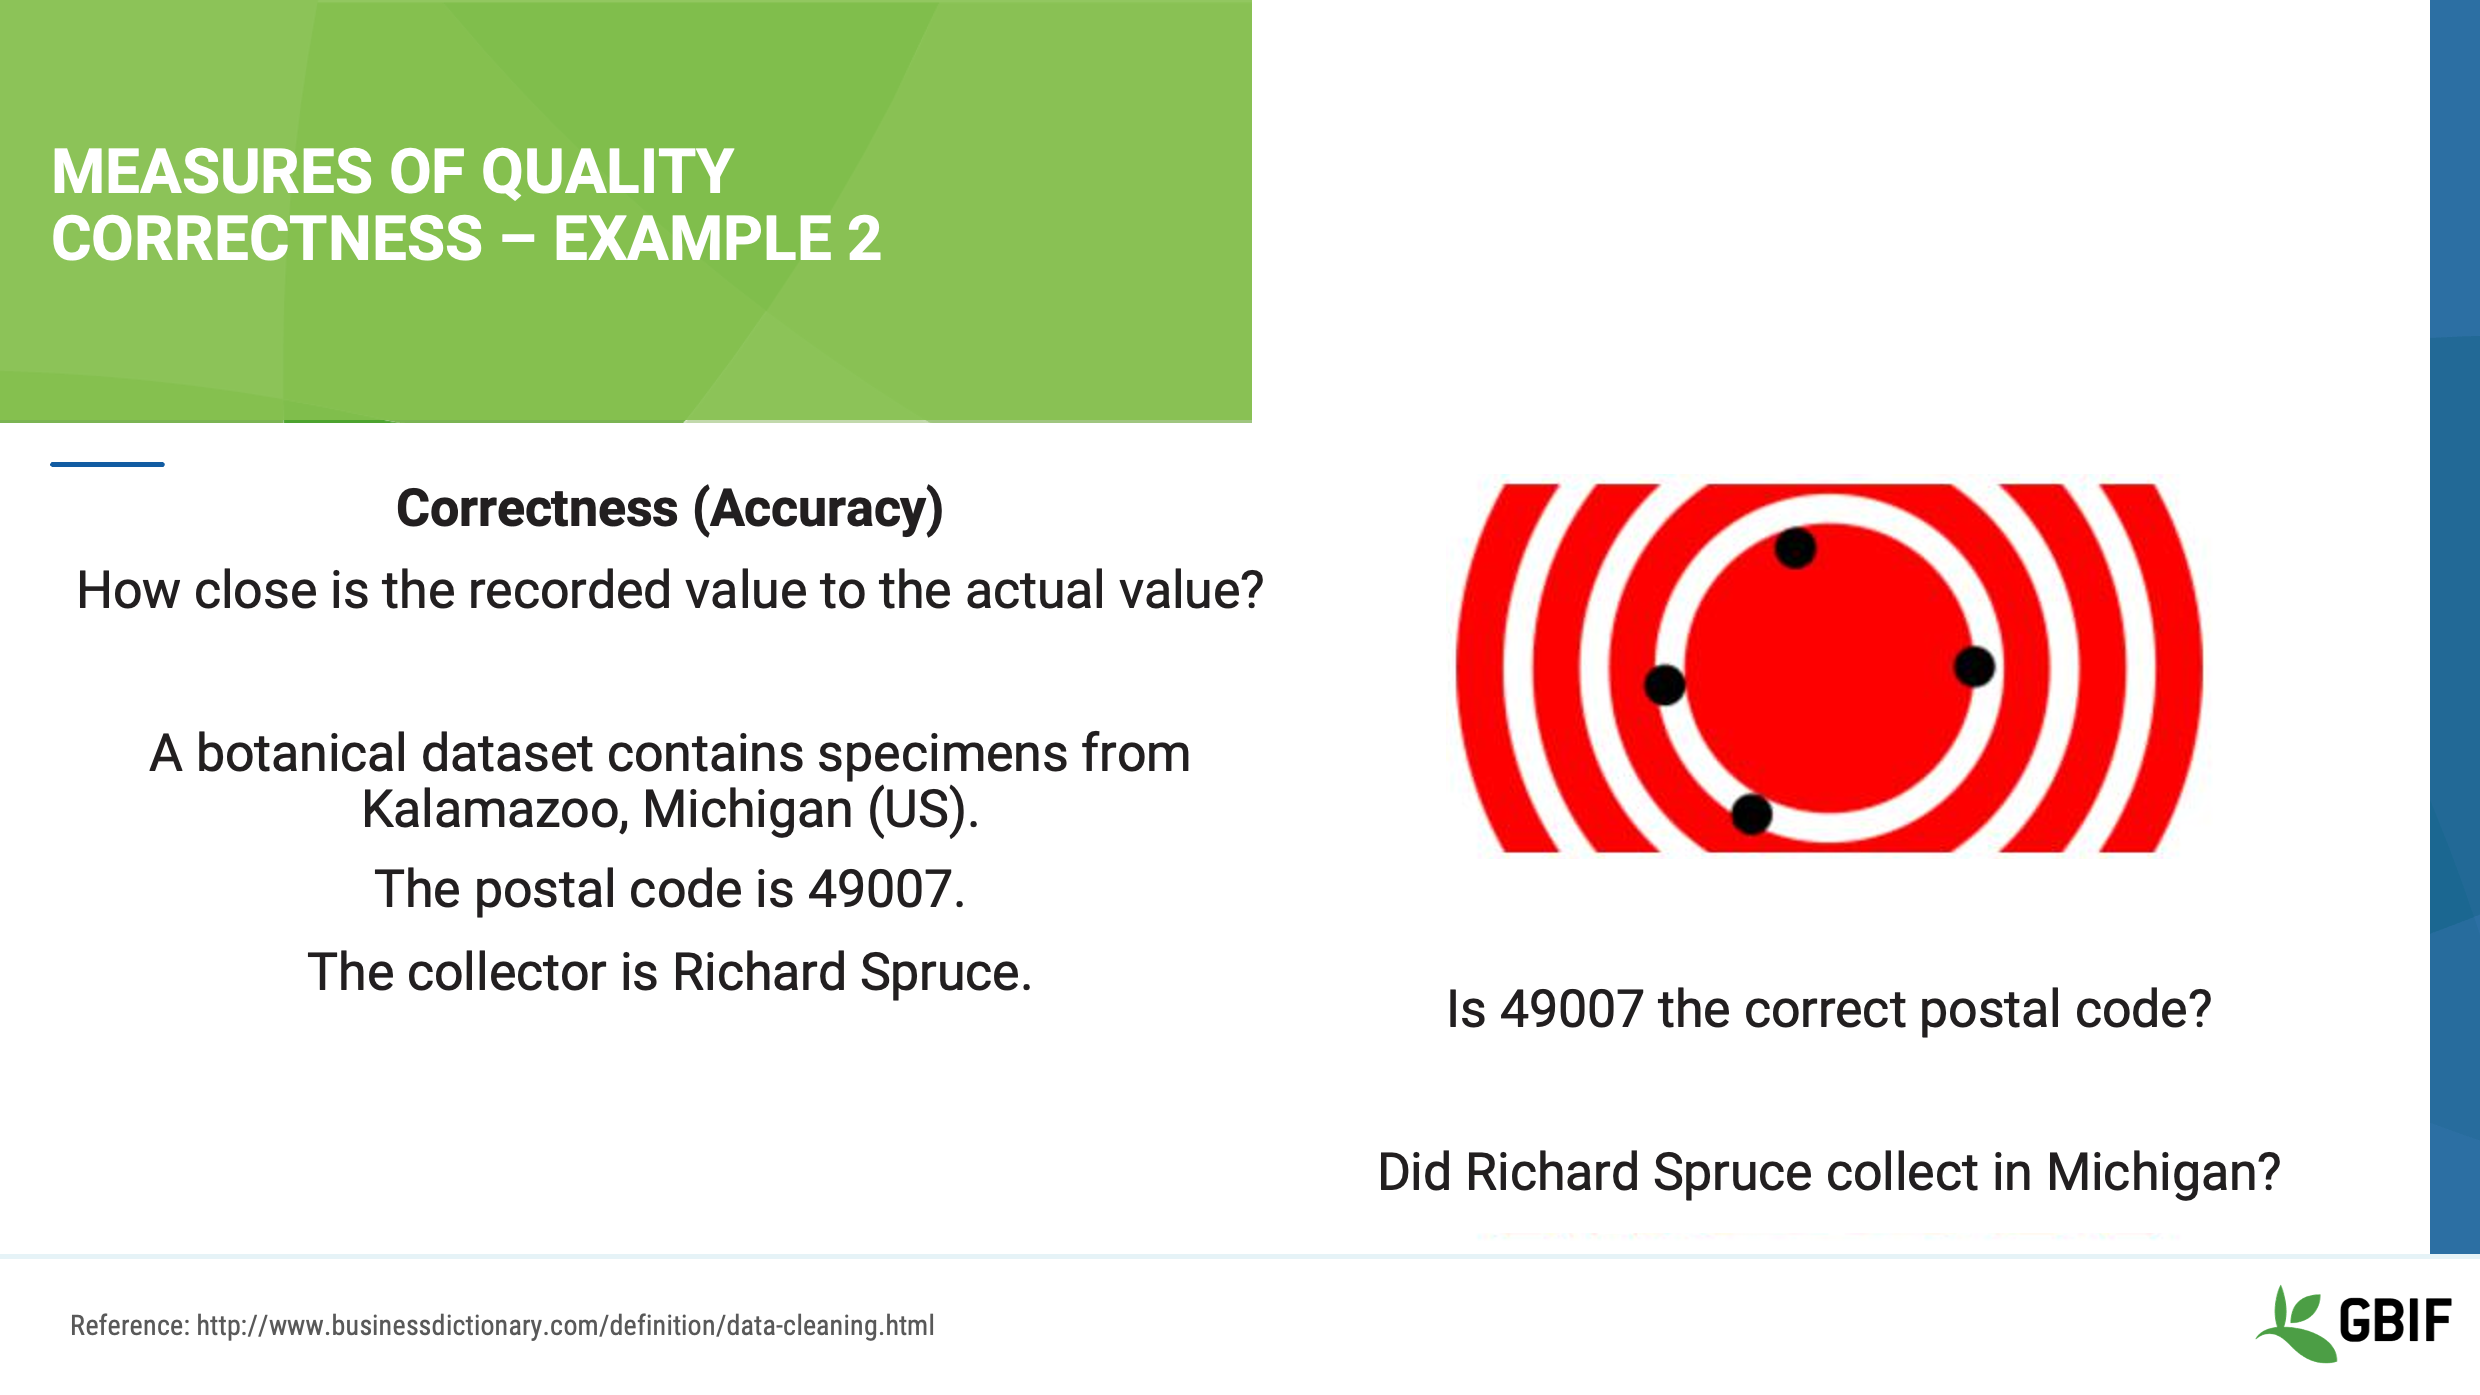
Slide 17 - Measures of quality correctness - Example 2
Let’s look at another example. Here, your dataset contains specimens collected in a place called Kalamazoo by a scientist named Richard Spruce.
We must ask ourselves:
Is 49007 the right postal code for Kalamazoo?
Did Richard Spruce collect in Michigan?
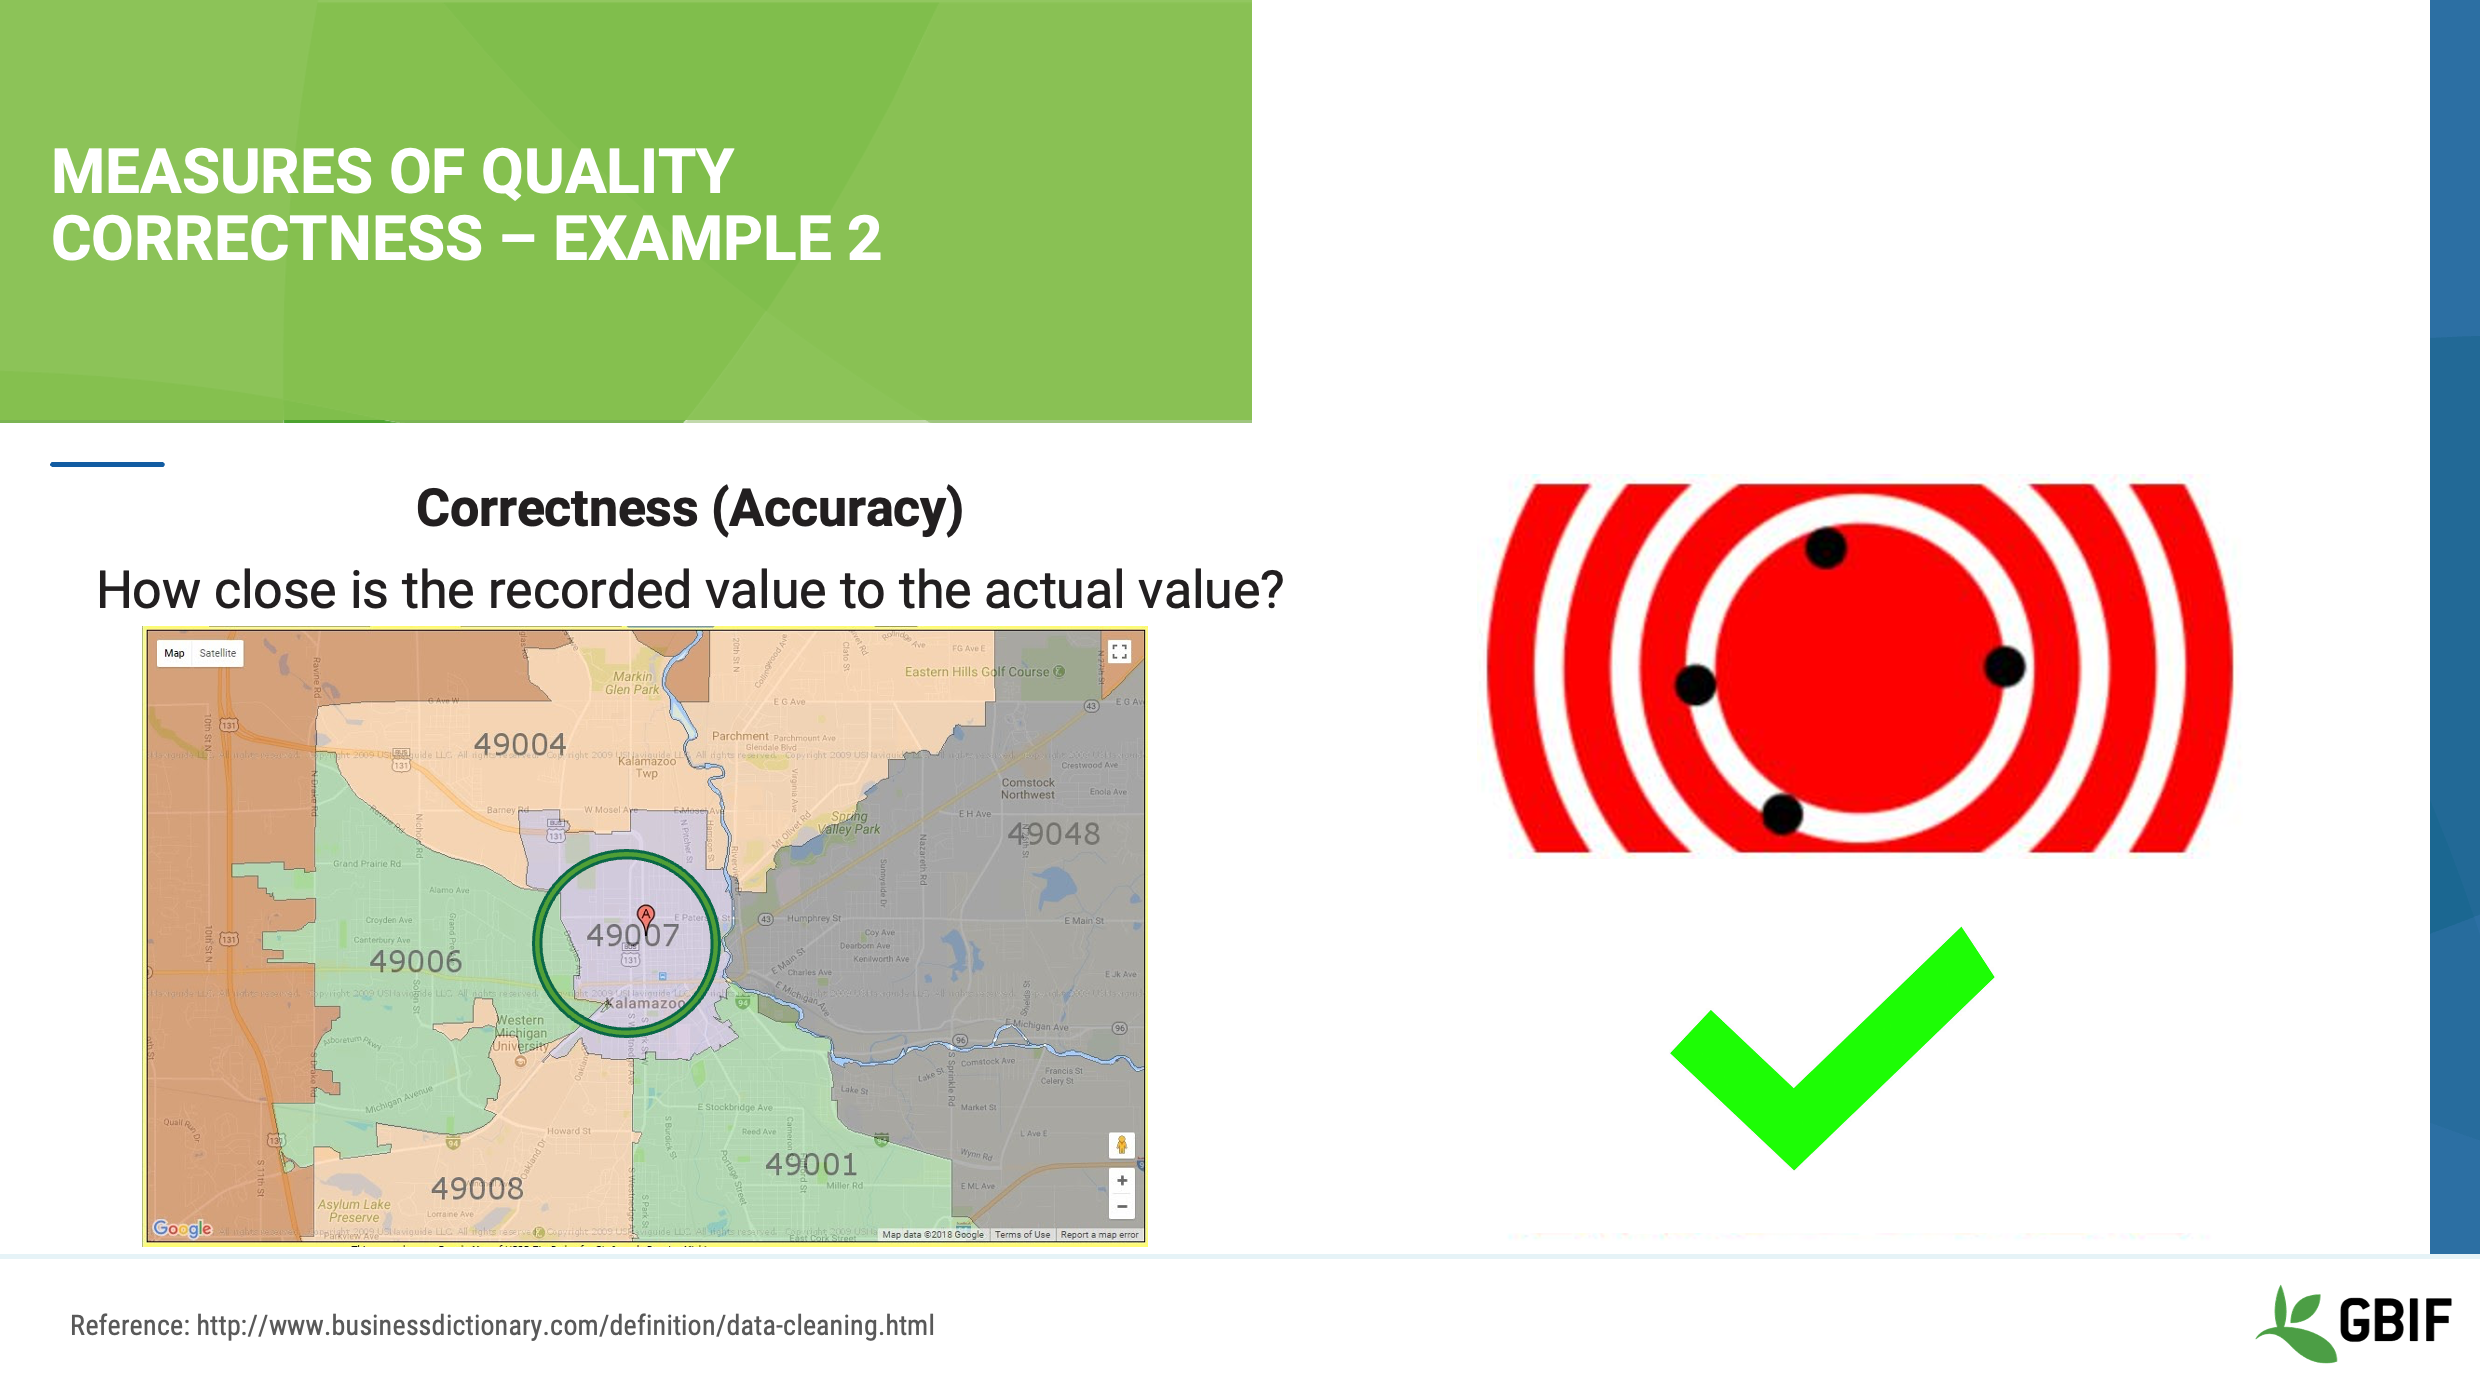
Slide 18 - Measures of quality correctness - Example 2
In this case, the answer is yes to our first question, 49007 is a postal code for Kalamazoo, so the accuracy of the locality is good, but what about the collector, Richard Spruce?
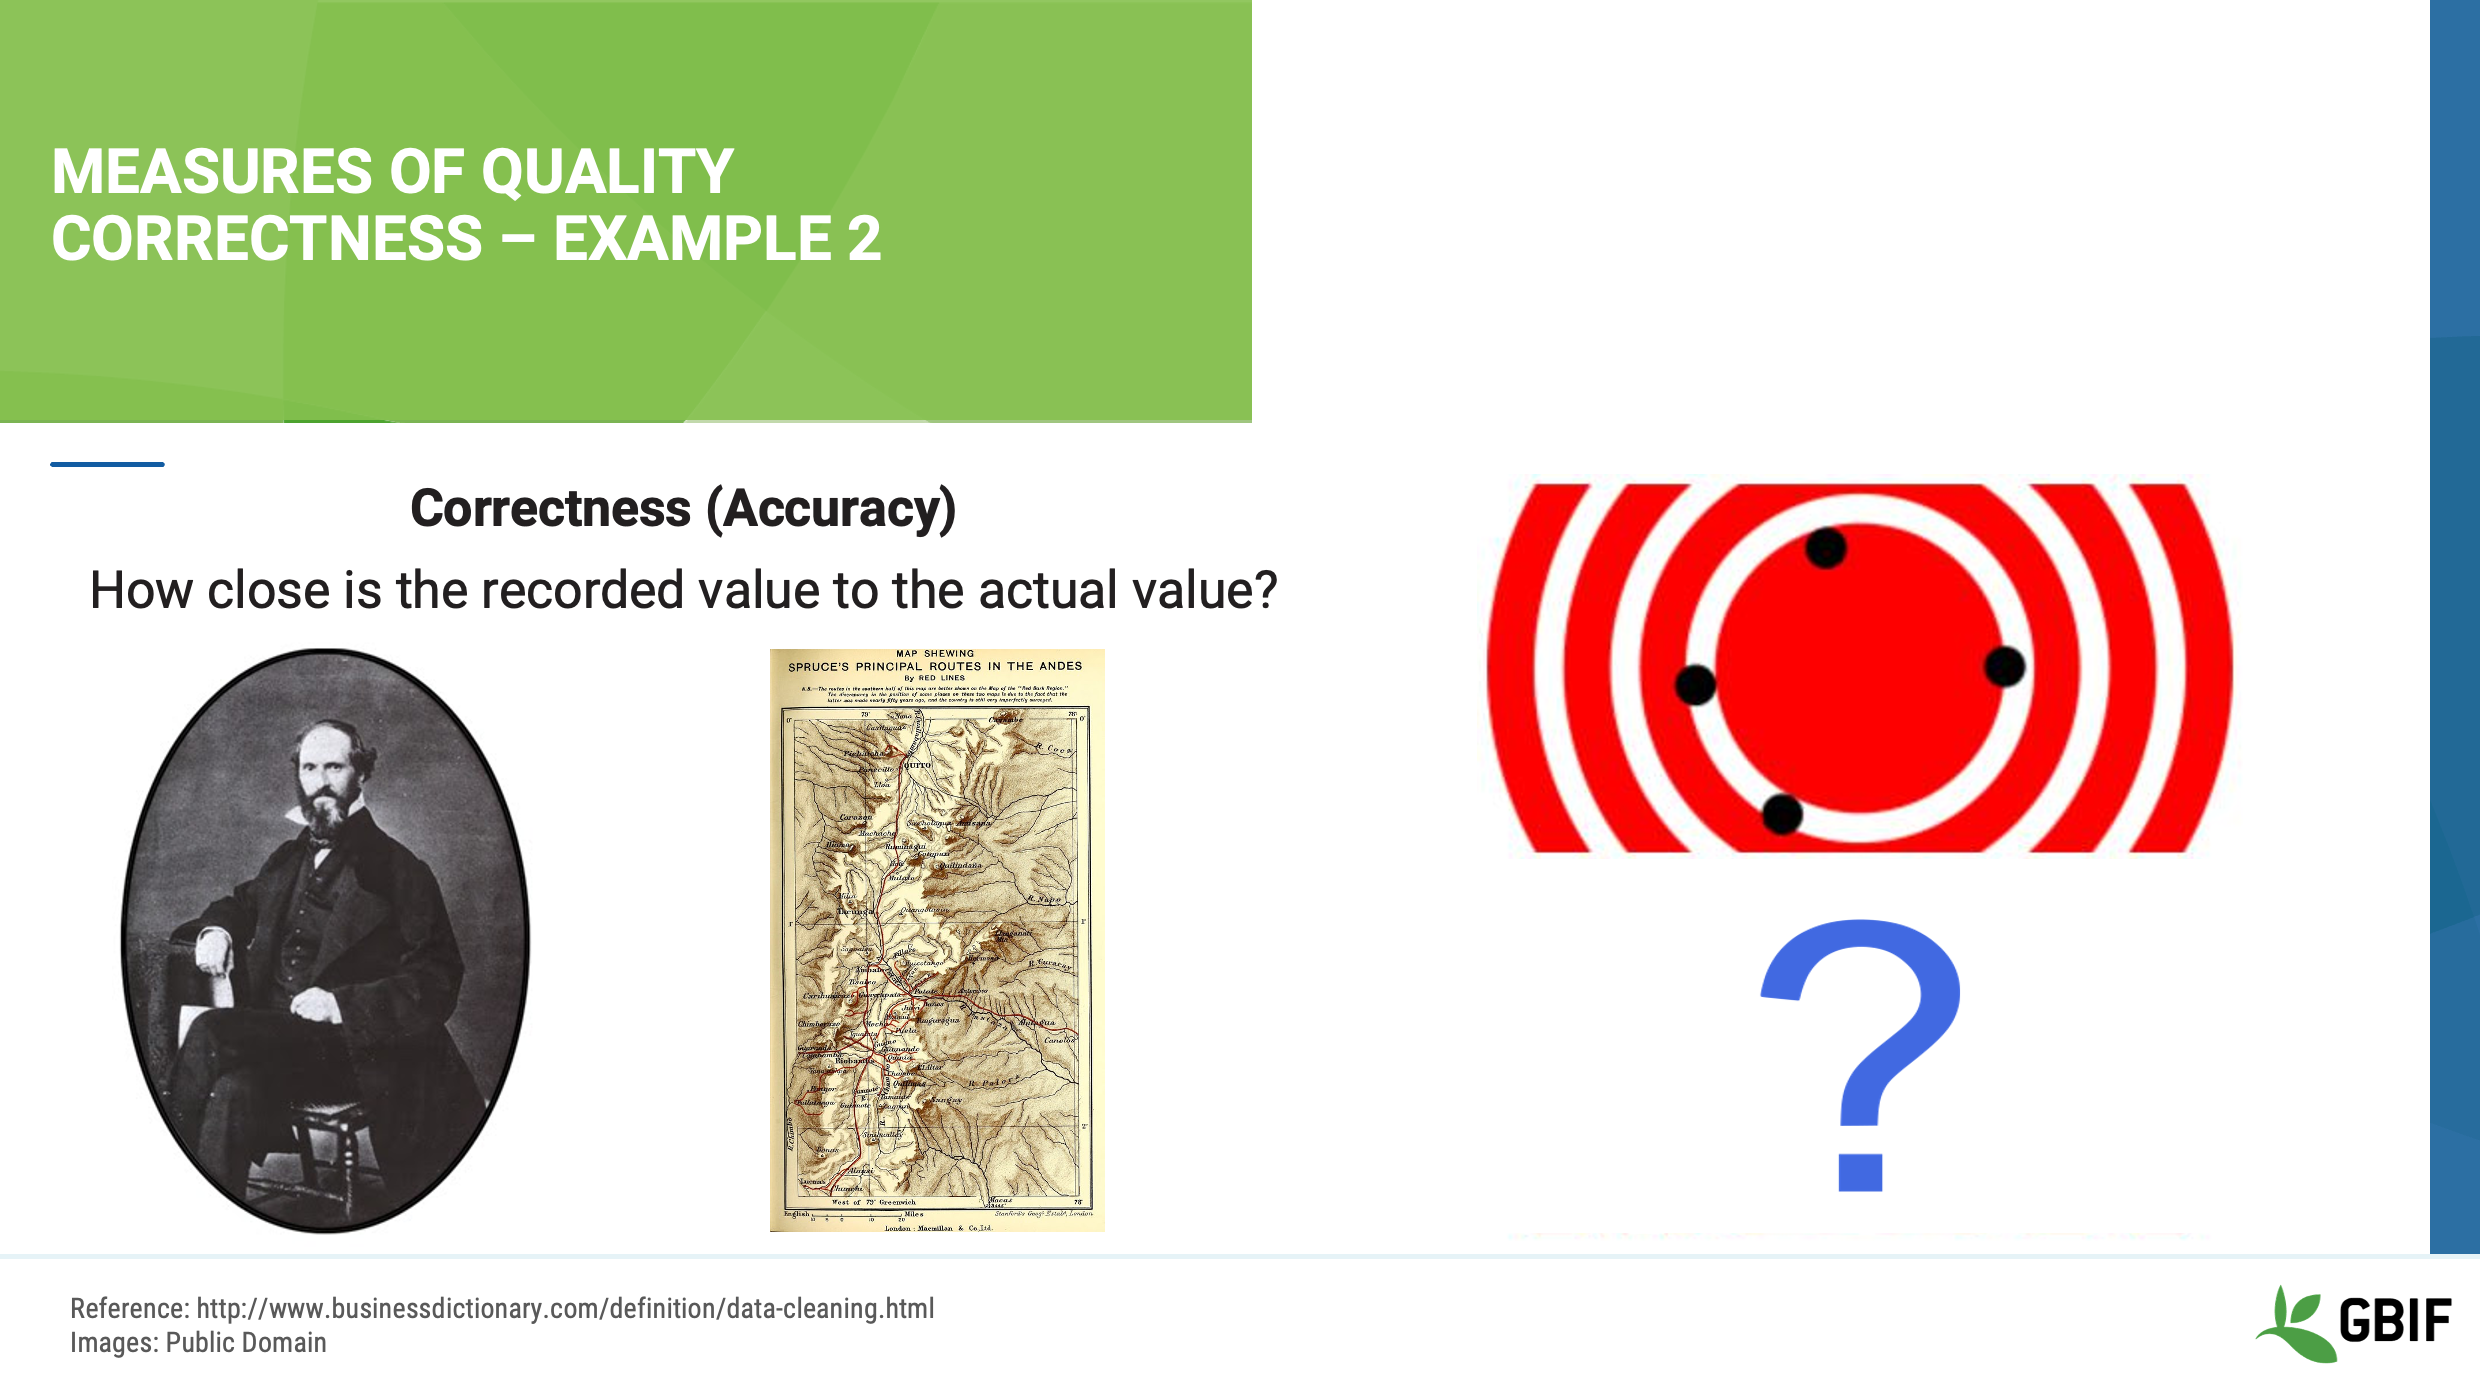
Image references: https://en.wikipedia.org/wiki/Richard_Spruce#/media/File:Spruce_Richard.jpg https://archive.org/details/notesofbotanisto21908spru
Slide 19 - Measures of quality correctness - Example 2
There is, in fact, a famous botanist named Richard Spruce. He was born in 1817 and died in 1893, but he conducted his collecting in the Amazon Basin and Andes mountains in South America. Something is not quite right, so we need to find out more about the collector before we can be confident in the correctness of these data.
Image references: https://en.wikipedia.org/wiki/Richard_Spruce#/media/File:Spruce_Richard.jpg https://archive.org/details/notesofbotanisto21908spru
Slide 20 - Measures of quality consistency
Let’s take a look now at what Consistency, or precision, means to data.
Consistency represents how many times you get the same answer, regardless of where the center of the target lies.
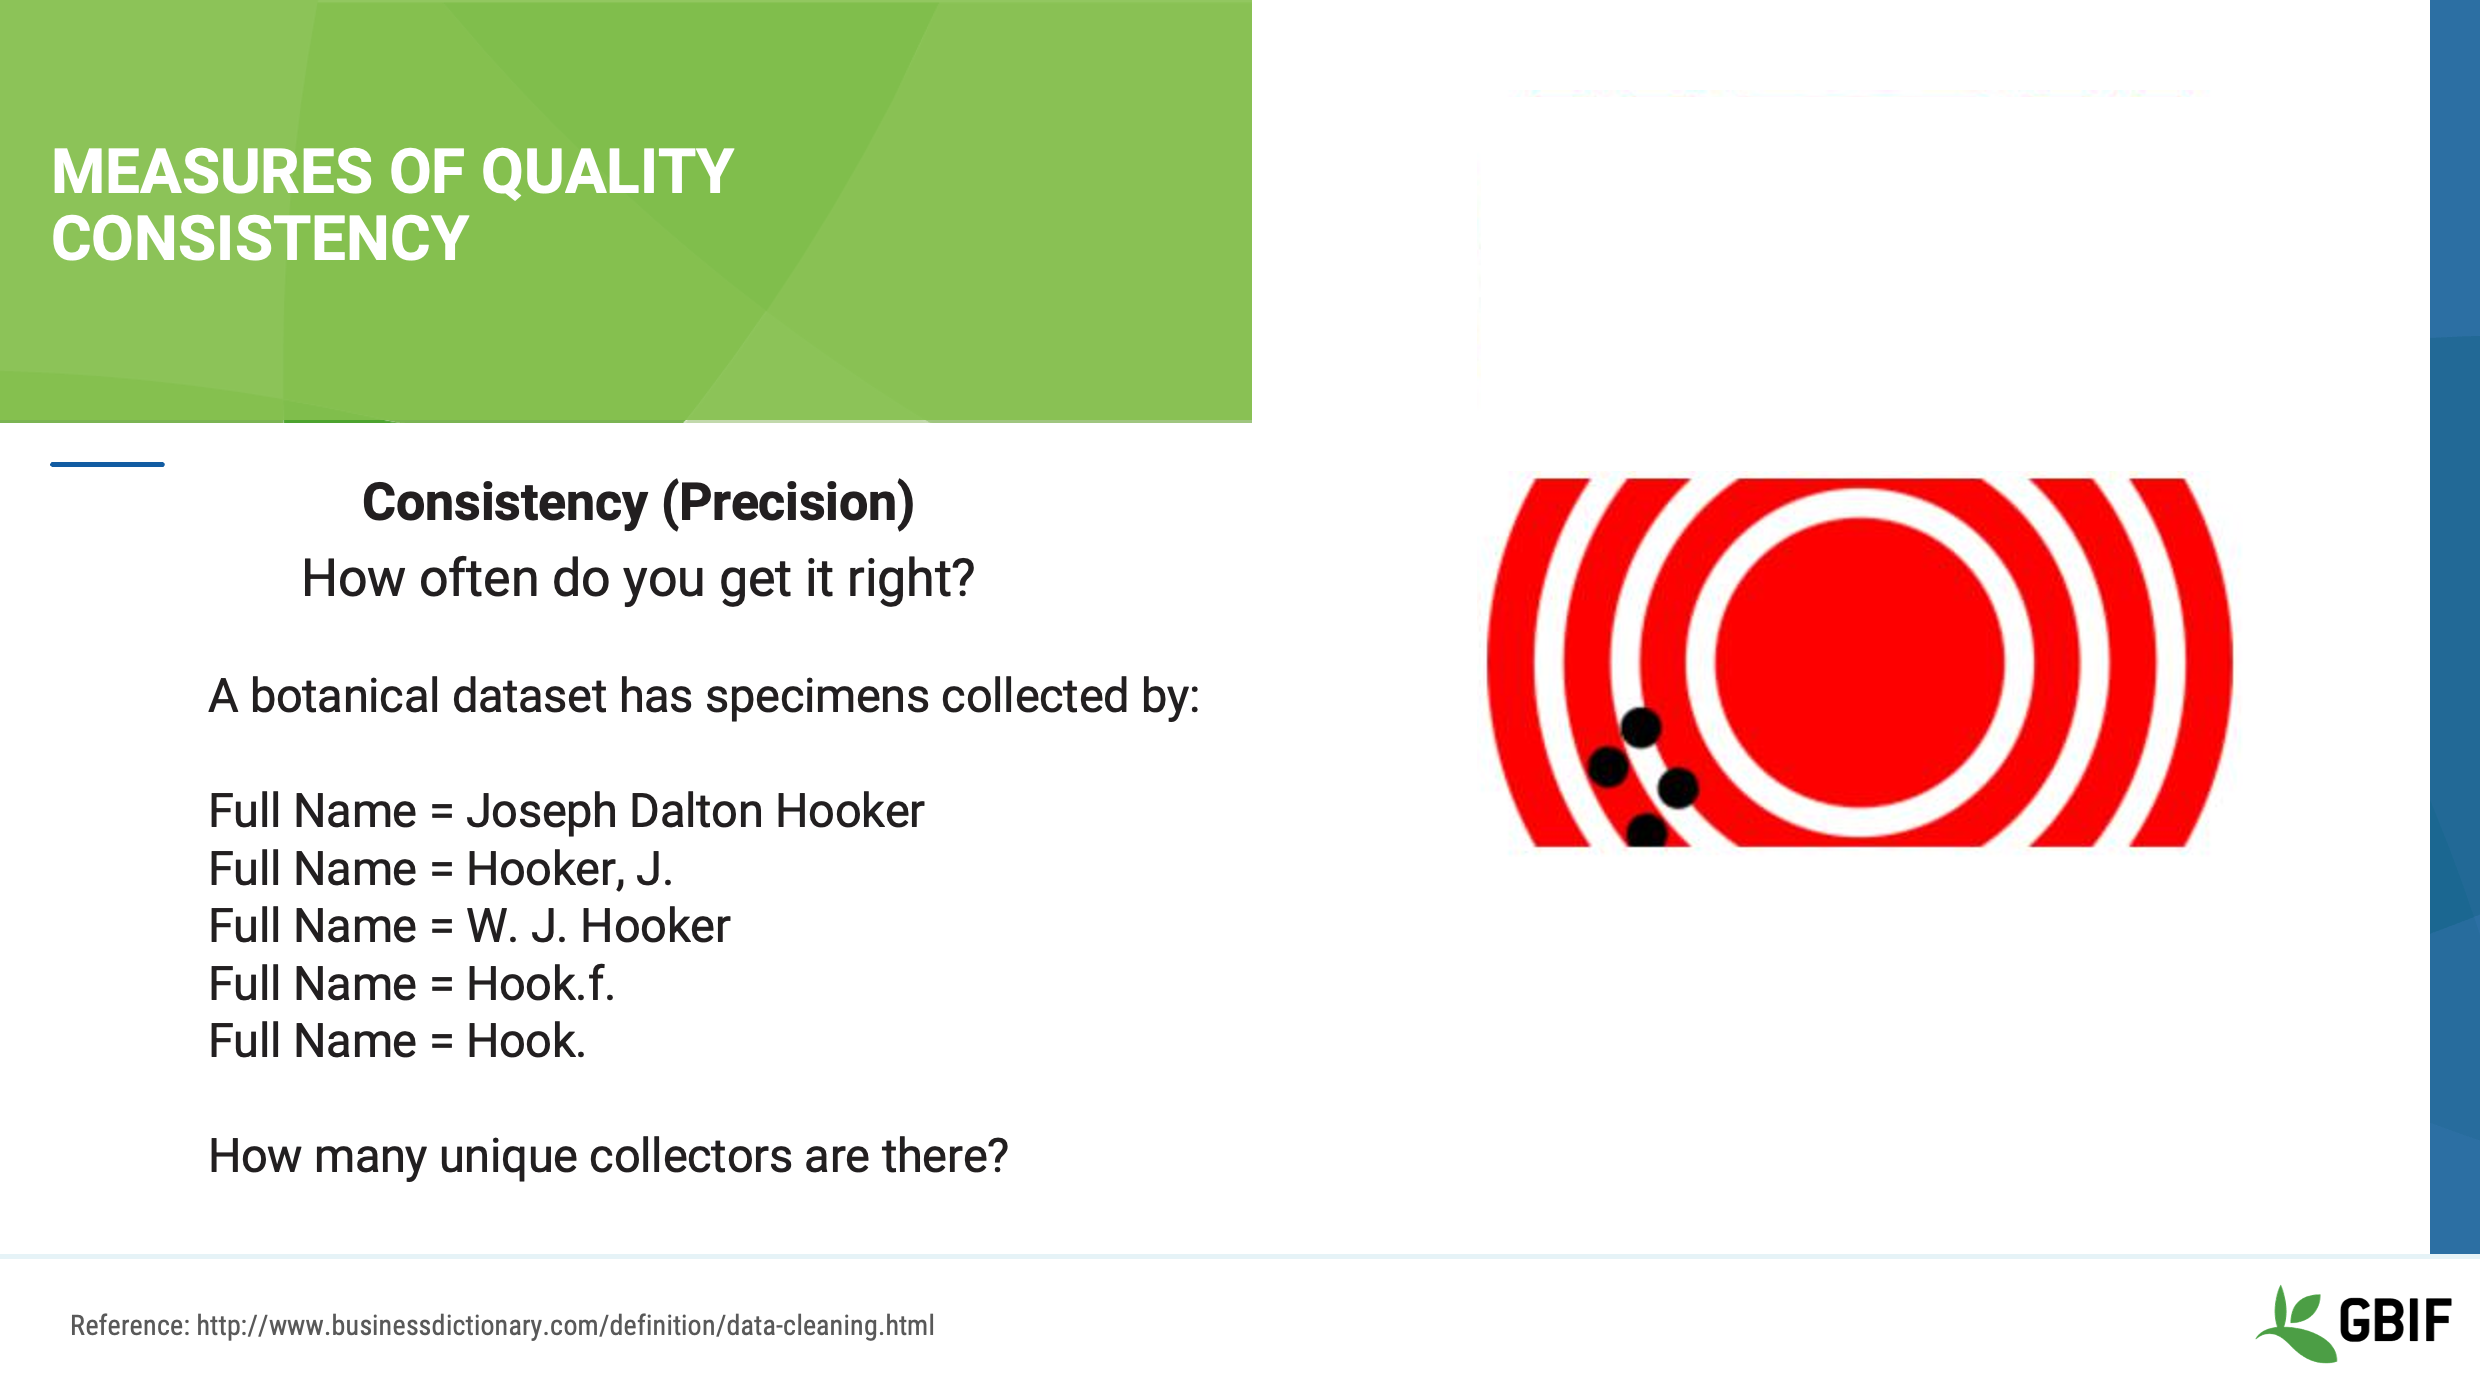
For example, your dataset contains botanical occurrences including a field, or column, named “Full Name”. This field contains the name of the specimen collector. As you can see there are five different names, but how many unique collectors are there? Can you tell just by looking at the names?

Slide 21 - Measures of quality consistency
Sometimes, if you are familiar with the dataset, you might know how many collectors are represented just by looking at the data, but if you don’t know these data well, you might need to do some research, ask some questions or look at the original field notes.
In this example, if you guessed that these five names represent two or three unique collectors, you would be right:
In blue, Joseph Dalton Hooker AND Hook.f. are the same person. Hook.f. is the abbreviation used for Joseph Dalton Hooker (1817-1911).
In green, W. J. Hooker and Hook. are the same person. Hook. is the abbreviation for William Jackson Hooker (1785-1865). William was actually Joseph’s father.
Finally, in the red, there is “Hooker, J.” This entry could be an error or typo of either Joseph or William Hooker, OR it could be a third person with a similar name. Thus, more research would be needed to clarify these data.
Slide 22 - Data cleaning
We have just discussed several simple illustrations of two measures of data quality. These examples should give you a basic understanding about how to identify the inaccuracies and imprecisions in data.
How we document and fix these issues or errors is a process that we call data cleaning. More specifically:
Data cleaning is the process of correcting or removing dirty data caused by contradictions, disparities, keying mistakes, missing bits, and more. It also includes validation of the changes made, and may require normalization.
Our data cleaning, or lack thereof, will affect how data users perceive your data’s fitness for use.
It is not necessary for you to do all the data cleaning yourself, in fact, a common misconception is that all errors MUST be fixed before you can share your data.
The truth is that you can only clean as much data as your time, knowledge, and resources permit. As a result, it is essential to document what you know and what you do not know about your data so that when you do share them, data users will know the level of the quality of your data.

Slide 23 - Conclusion
This video is part of a series of presentations used in the GBIF Biodiversity Data Mobilization course. The biodiversity data mobilization curriculum was originally developed as part of the Biodiversity Information Development Programme funded by the European Union.
This presentation was originally created by Sharon Grant with additional contributions by Dag Endresen and David Bloom. This presentation has been narrated by David Bloom.
Principles of data quality
| Below you will find a selected reading from Arthur Chapman’s guide “Principles of data quality”. Full document, references and translations can be found on GBIF.org. |
Before a detailed discussion on data quality and its application to species-occurrence data can take place, there are a number of concepts that need to be defined and described. These include the term data quality itself, the terms accuracy and precision that are often misapplied, and what we mean by primary species data and species-occurrence data.
Species-occurrence data
Species-occurrence data is used here to include specimen label data attached to specimens or lots housed in museums and herbaria, observational data and environmental survey data. In general, the data are what we term “point-based”, although line (transect data from environmental surveys, collections along a river), polygon (observations from within a defined area such as a national park) and grid data (observations or survey records from a regular grid) are also included. In general we are talking about georeferenced data – i.e. records with geographic references that tie them to a particular place in space – whether with a georeferenced coordinate (e.g. latitude and longitude, UTM) or not (textual description of a locality, altitude, depth) – and time (date, time of day).
In general the data are also tied to a taxonomic name, but unidentified collections may also be included. The term has occasionally been used interchangeably with the term “primary species data”.
Primary species data
“Primary species data” is used to describe raw collection data and data without any spatial attributes. It includes taxonomic and nomenclatural data without spatial attributes, such as names, taxa and taxonomic concepts without associated geographic references.
Accuracy and Precision
Accuracy and precision are regularly confused and the differences are not generally understood.
Accuracy refers to the closeness of measured values, observations or estimates to the real or true value (or to a value that is accepted as being true – for example, the coordinates of a survey control point).
Precision (or Resolution) can be divided into two main types. Statistical precision is the closeness with which repeated observations conform to themselves. They have nothing to do with their relationship to the true value, and may have high precision, but low accuracy. Numerical precision is the number of significant digits that an observation is recorded in and has become far more obvious with the advent of computers. For example a database may output a decimal latitude/longitude record to 10 decimal places – i.e. ca .01 mm when in reality the record has a resolution no greater than 10-100 m (3-4 decimal places). This often leads to a false impression of both the resolution and the accuracy.
These terms – accuracy and precision – can also be applied to non-spatial data as well as to spatial data. For example, a collection may have an identification to subspecies level (i.e. have high precision), but be the wrong taxon (i.e. have low accuracy), or be identified only to Family level (high accuracy, but low precision).
Data quality
Data quality is multidimensional, and involves data management, modelling and analysis, quality control and assurance, storage and presentation. As independently stated by Chrisman (1991) and Strong et al. (1997), data quality is related to use and cannot be assessed independently of the user. In a database, the data have no actual quality or value (Dalcin 2004); they only have potential value that is realized only when someone uses the data to do something useful. Information quality relates to its ability to satisfy its customers and to meet customers’ needs (English 1999).
Redman (2001), suggested that for data to be fit for use they must be accessible, accurate, timely, complete, consistent with other sources, relevant, comprehensive, provide a proper level of detail, be easy to read and easy to interpret.
One issue that a data custodian may need to consider is what may need to be done with the database to increase its usability to a wider audience (i.e. increase its potential use or relevance) and thus make it fit for a wider range of purposes. There will be a trade off in this between the increased usability and the amount of effort required to add extra functionality and usability. This may require such things as atomizing data fields, adding geo-referencing information, etc.
Quality Assurance/ Quality Control
The difference between quality control and quality assurance is not always clear. Taulbee (1996) makes the distinction between Quality Control and Quality Assurance and stresses that one cannot exist without the other if quality goals are to be met. She defines Quality Control as a judgement of quality based on internal standards, processes and procedures established to control and monitor quality; and Quality Assurance as a judgement of quality based on standards external to the process and is the reviewing of the activities and quality control processes to insure that the final products meet predetermined standards of quality.
In a more business-oriented approach, Redman (2001) defines Quality Assurance as “those activities that are designed to produce defect-free information products to meet the most important needs of the most important customers, at the lowest possible cost”.
How these terms are to be applied in practice is not clear, and in most cases the terms seem to be largely used synonymously to describe the overall practice of data quality management.
Uncertainty
Uncertainty may be thought of as a “measure of the incompleteness of one’s knowledge or information about an unknown quantity whose true value could be established if a perfect measuring device were available” (Cullen and Frey 1999). Uncertainty is a property of the observer’s understanding of the data, and is more about the observer than the data per se. There is always uncertainty in data; the difficulty is in recording, understanding and visualizing that uncertainty so that others can also understand it. Uncertainty is a key term in understanding risk and risk assessment.
Error
Error encompasses both the imprecision of data and their inaccuracies. There are many factors that contribute to error. Error is generally seen as being either random or systematic. Random error tends to refer to deviation from the true state in a random manner. Systematic error or bias arises from a uniform shift in values and is sometimes described as having ‘relative accuracy’ in the cartographic world (Chrisman 1991). In determining ‘fitness for use’ systematic error may be acceptable for some applications, and unfit for others.
An example may be the use of a different geodetic datum1 – where, if used throughout the analysis, may not cause any major problems. Problems will arise though where an analysis uses data from different sources and with different biases – for example data sources that use different geodetic datums, or where identifications may have been carried out using an earlier version of a nomenclatural code.
“Because error is inescapable, it should be recognized as a fundamental dimension of data” (Chrisman 1991). Only when error is included in a representation of the data is it possible to answer questions about limitations in the data, and even limitations in current knowledge. Known errors in the three dimensions of space, attribute and time need to be measured, calculated, recorded and documented.
Validation and Cleaning
Validation is a process used to determine if data are inaccurate, incomplete, or unreasonable. The process may include format checks, completeness checks, reasonableness checks, limit checks, review of the data to identify outliers (geographic, statistical, temporal or environmental) or other errors, and assessment of data by subject area experts (e.g. taxonomic specialists). These processes usually result in flagging, documenting and subsequent checking of suspect records. Validation checks may also involve checking for compliance against applicable standards, rules, and conventions. A key stage in data validation and cleaning is to identify the root causes of the errors detected and to focus on preventing those errors from re-occurring (Redman 2001).
Data cleaning refers to the process of “fixing” errors in the data that have been identified during the validation process. The term is synonymous with “data cleansing”, although some use data cleansing to encompass both data validation and data cleaning. It is important in the data cleaning process that data is not inadvertently lost, and changes to existing information be carried out very carefully. It is often better to retain both the old (original data) and the new (corrected data) side by side in the database so that if mistakes are made in the cleaning process, the original information can be recovered.