Terminology
| This module provides an introduction to the language, terminology and definitions for some of the basic concepts, functions and processes related to biodiversity data mobilization. |
Definitions
|
In this video (12:02), you will review terminology used in this course. If you are unable to watch the embedded video, you can download it locally. (MP4 - 45.8 MB) |
Presentation transcript
Click to expand

Slide 1 - Foundations - Definitions terminology
This session is foundation work and part of the Terminology section. We will be introducing you to the language, terminology and definitions for some of the basic concepts, functions and processes that you are going to be putting into use during the rest of the course.
Image by Carsten Witzel, obtained via http://www.freeimages.com/photo/root-of-a-tree-1371557.
Image by Carsten Witzel, obtained via http://www.freeimages.com/photo/root-of-a-tree-1371557.
Slide 2 - Key concepts
First let’s review the structure of this session.
In the section on DEFINITIONS we will first try to clarify the use of the word “Data”.
We will then look at the terminology surrounding Fields, Labels and Lists.
And lastly, we will straighten out some concepts around characters and their mappings that will help prevent unwanted data messes.
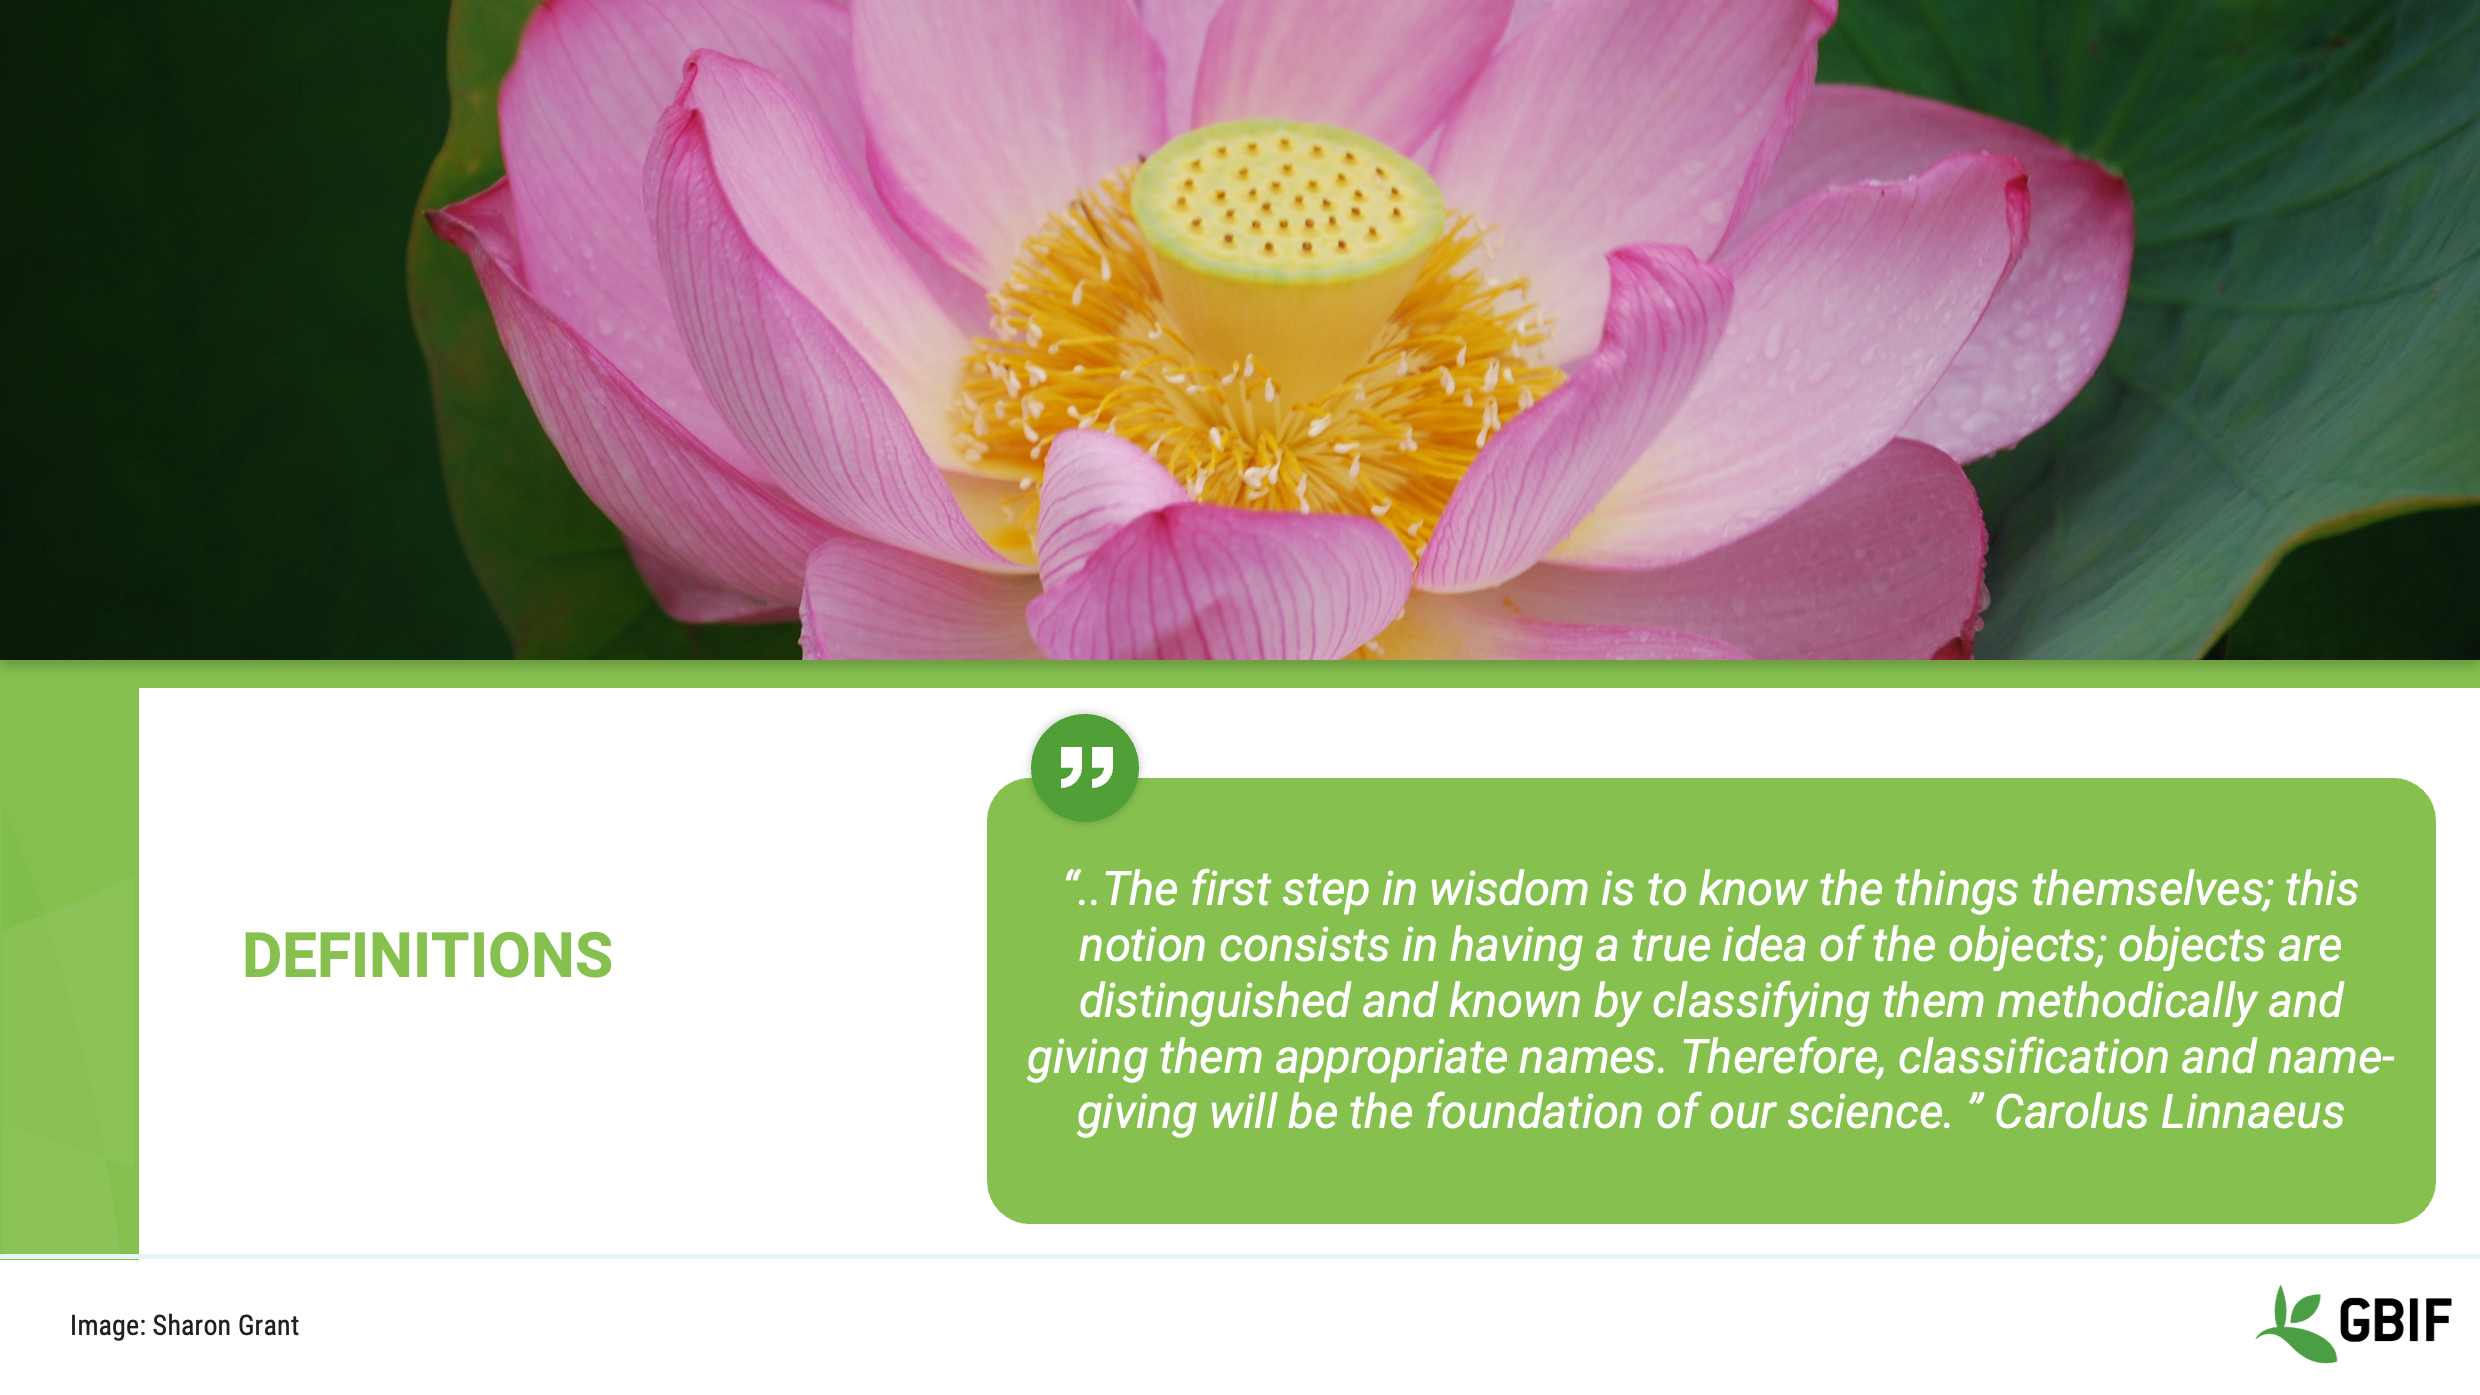
Slide 3 - Definitions
First definitions.
In this section we will look at some of the many different terms and phrases that exist within the world of data and information management.
We will be using these throughout the course and it is important that you be familiar with, when and how to use them.
Image by Sharon Grant: https://www.flickr.com/photos/rondls_pics/3629532537/in/album-72157619834323354/
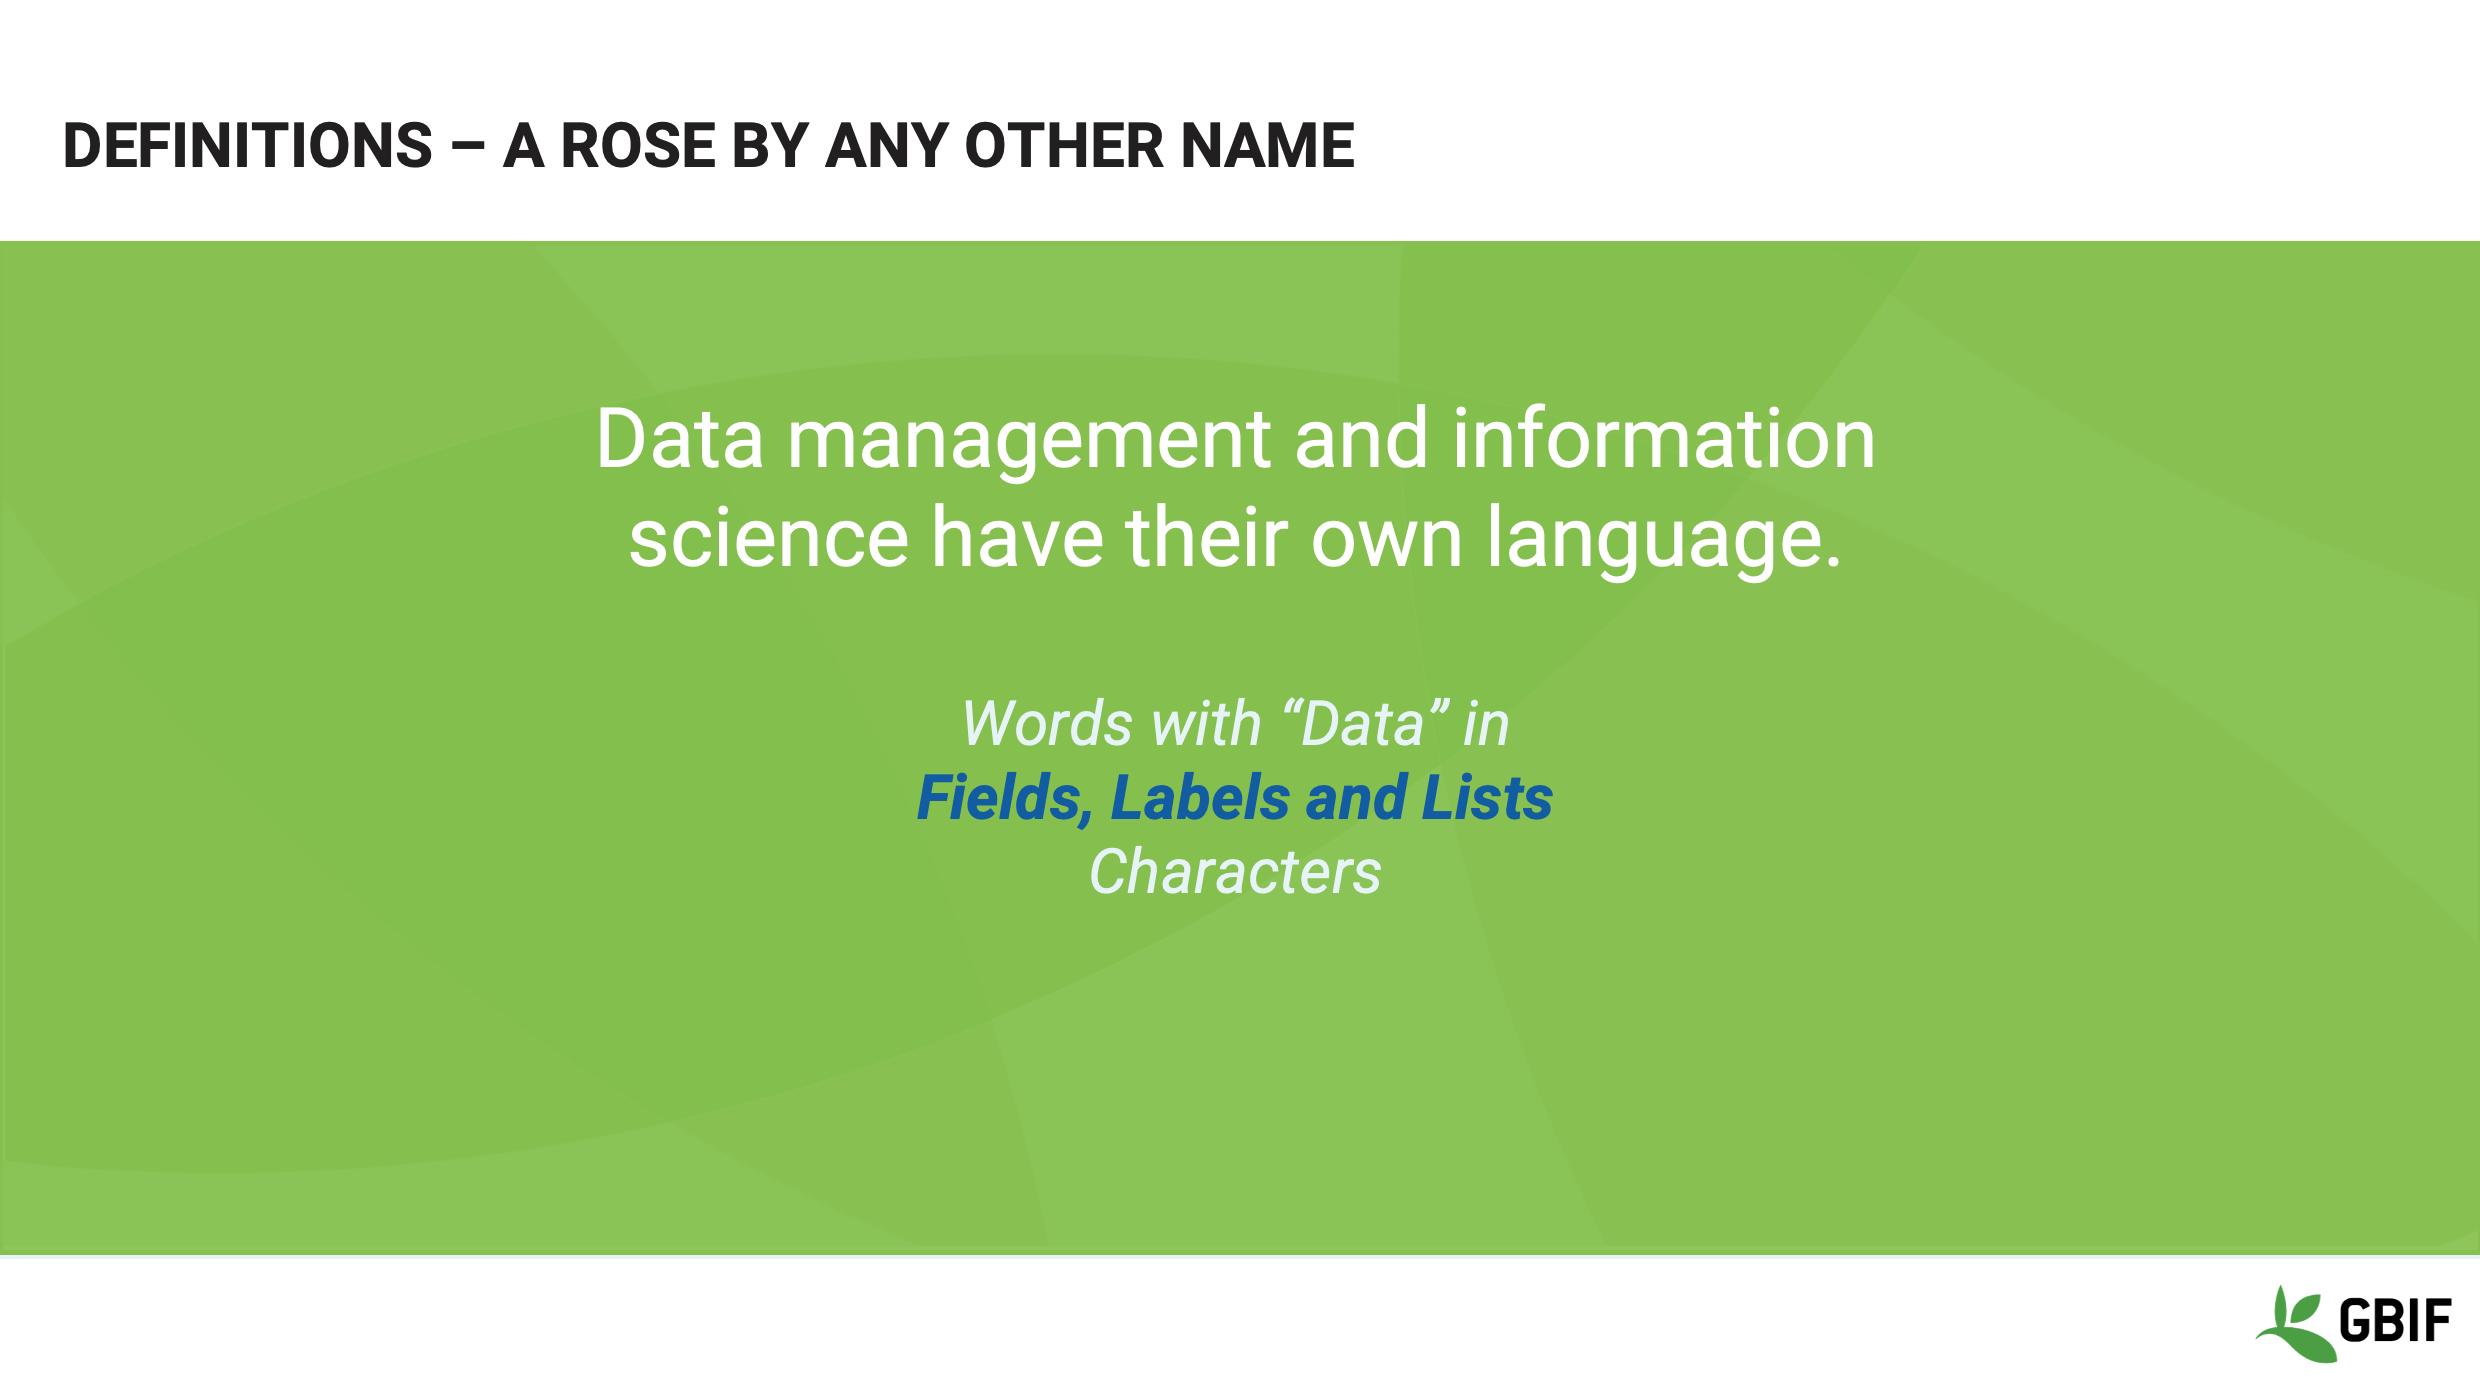
Slide 4 - Definitions - a rose by any other name
Let’s focus for a moment on some common words and phrases that contain the word data.
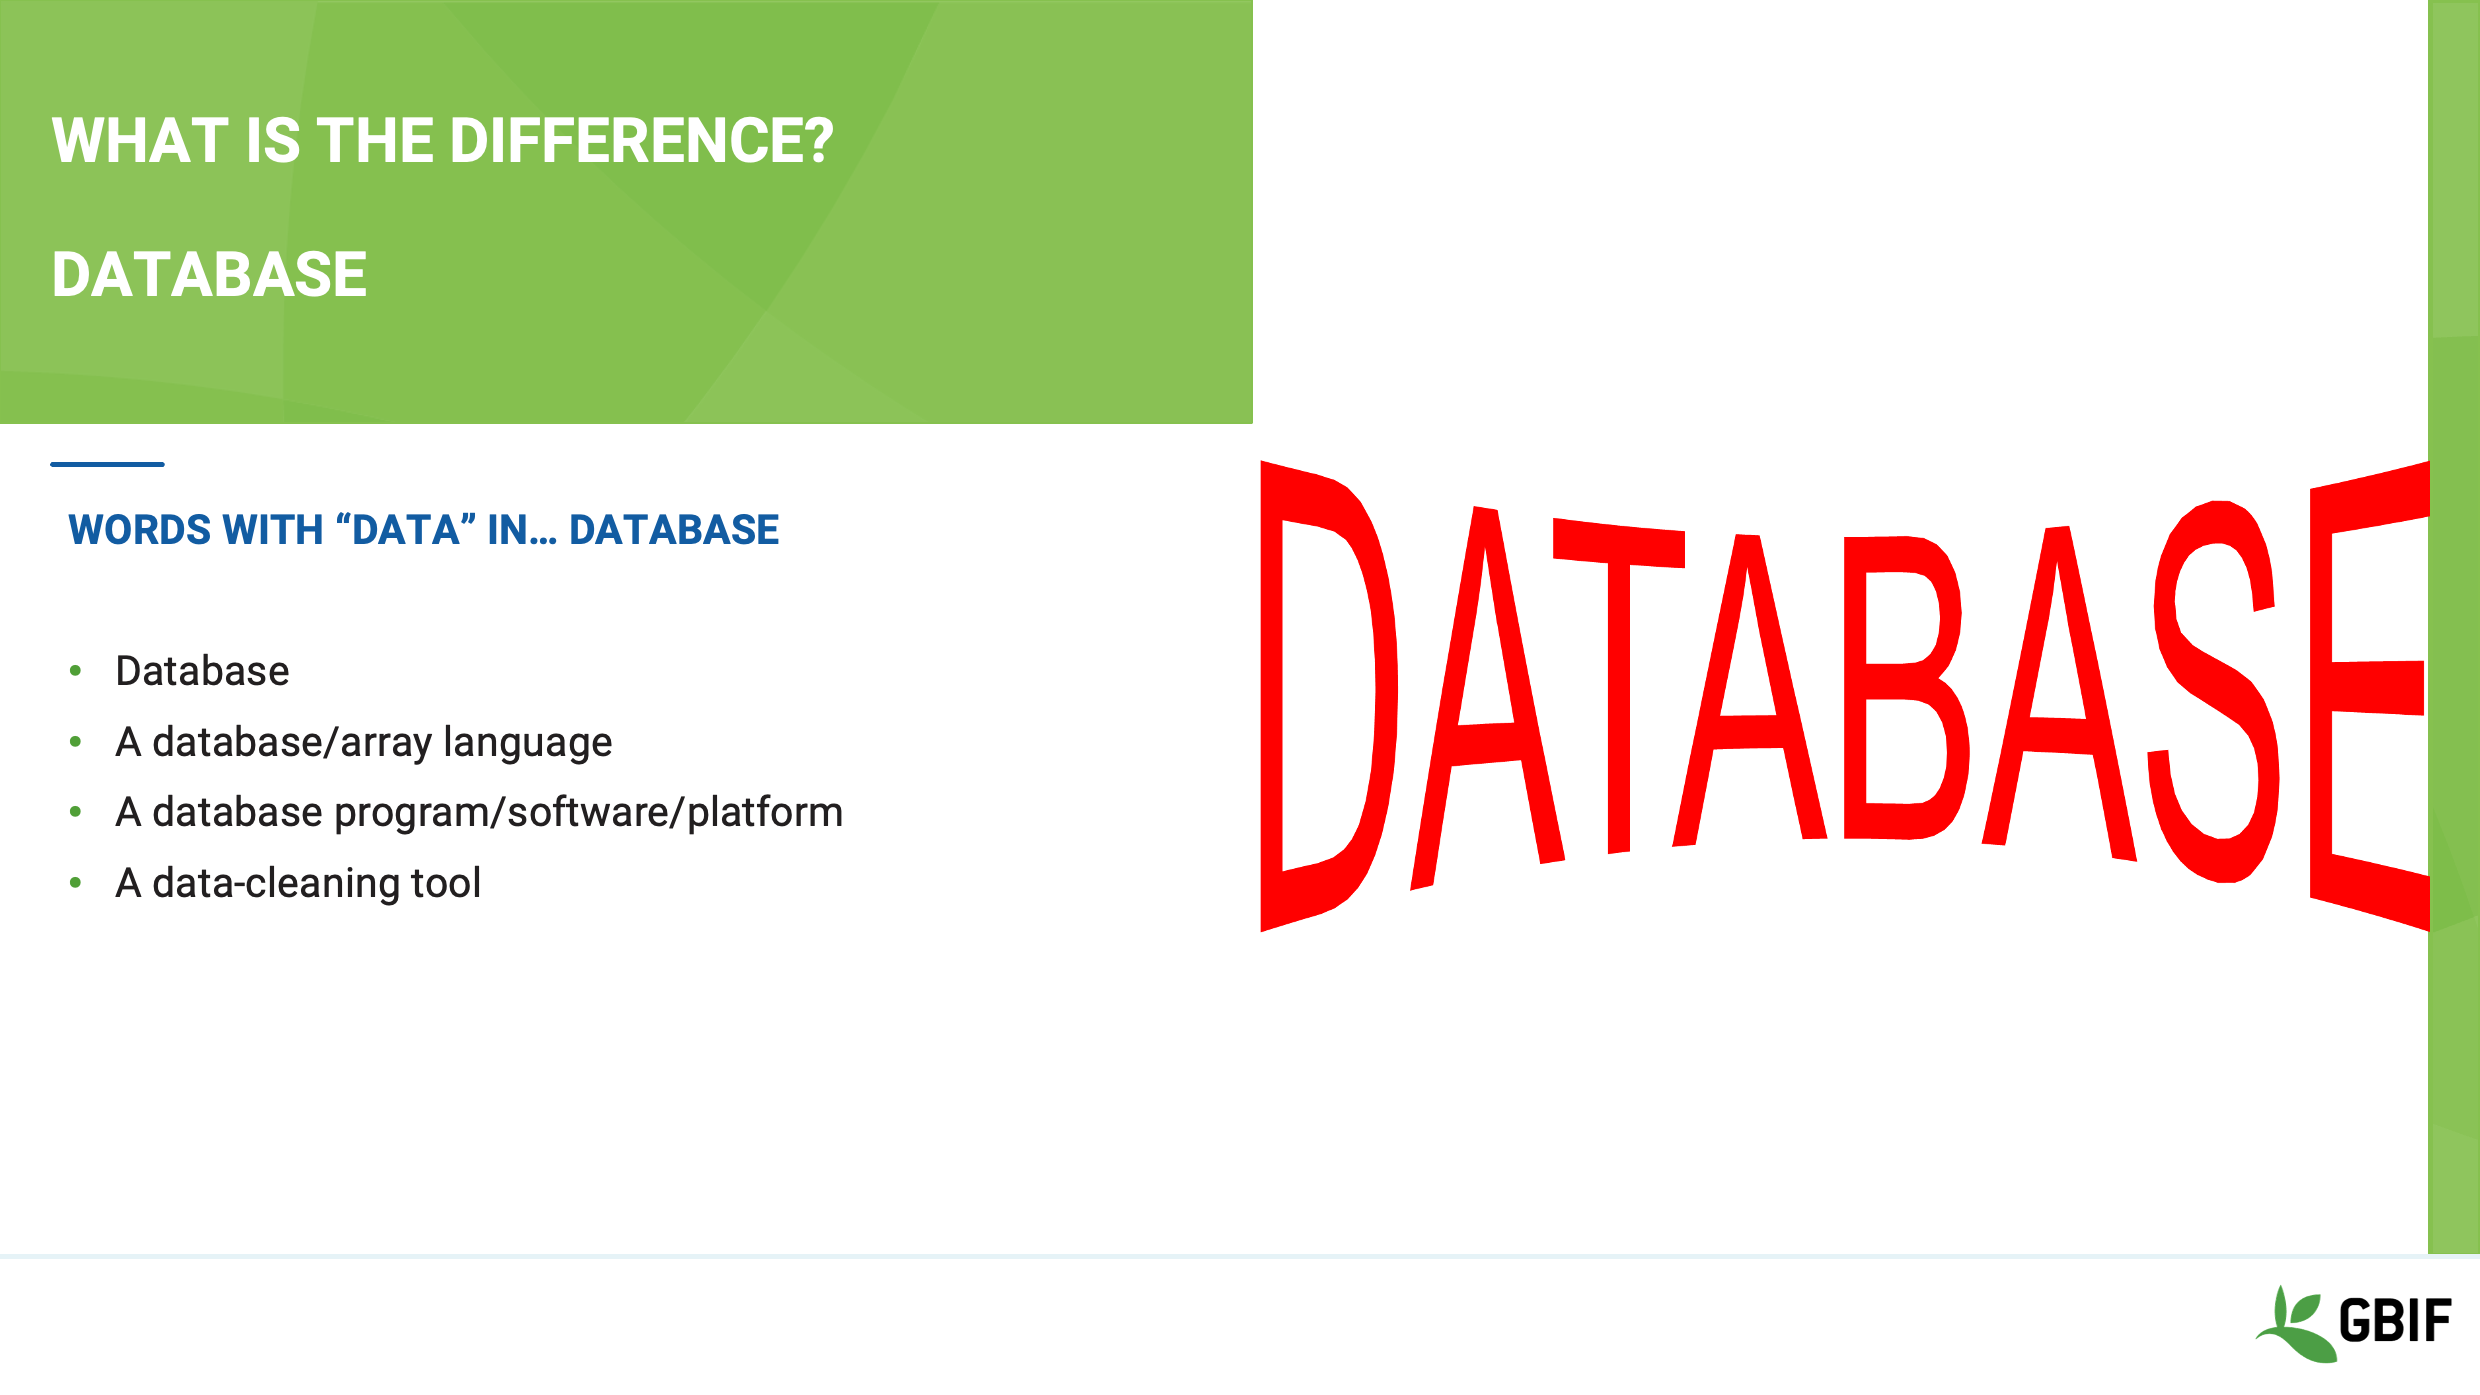
Slide 5 - What’s the difference - Database
All of the phrases here include the word data, but are they all the same, and if not, then what is the difference?
Slide 6 - Database
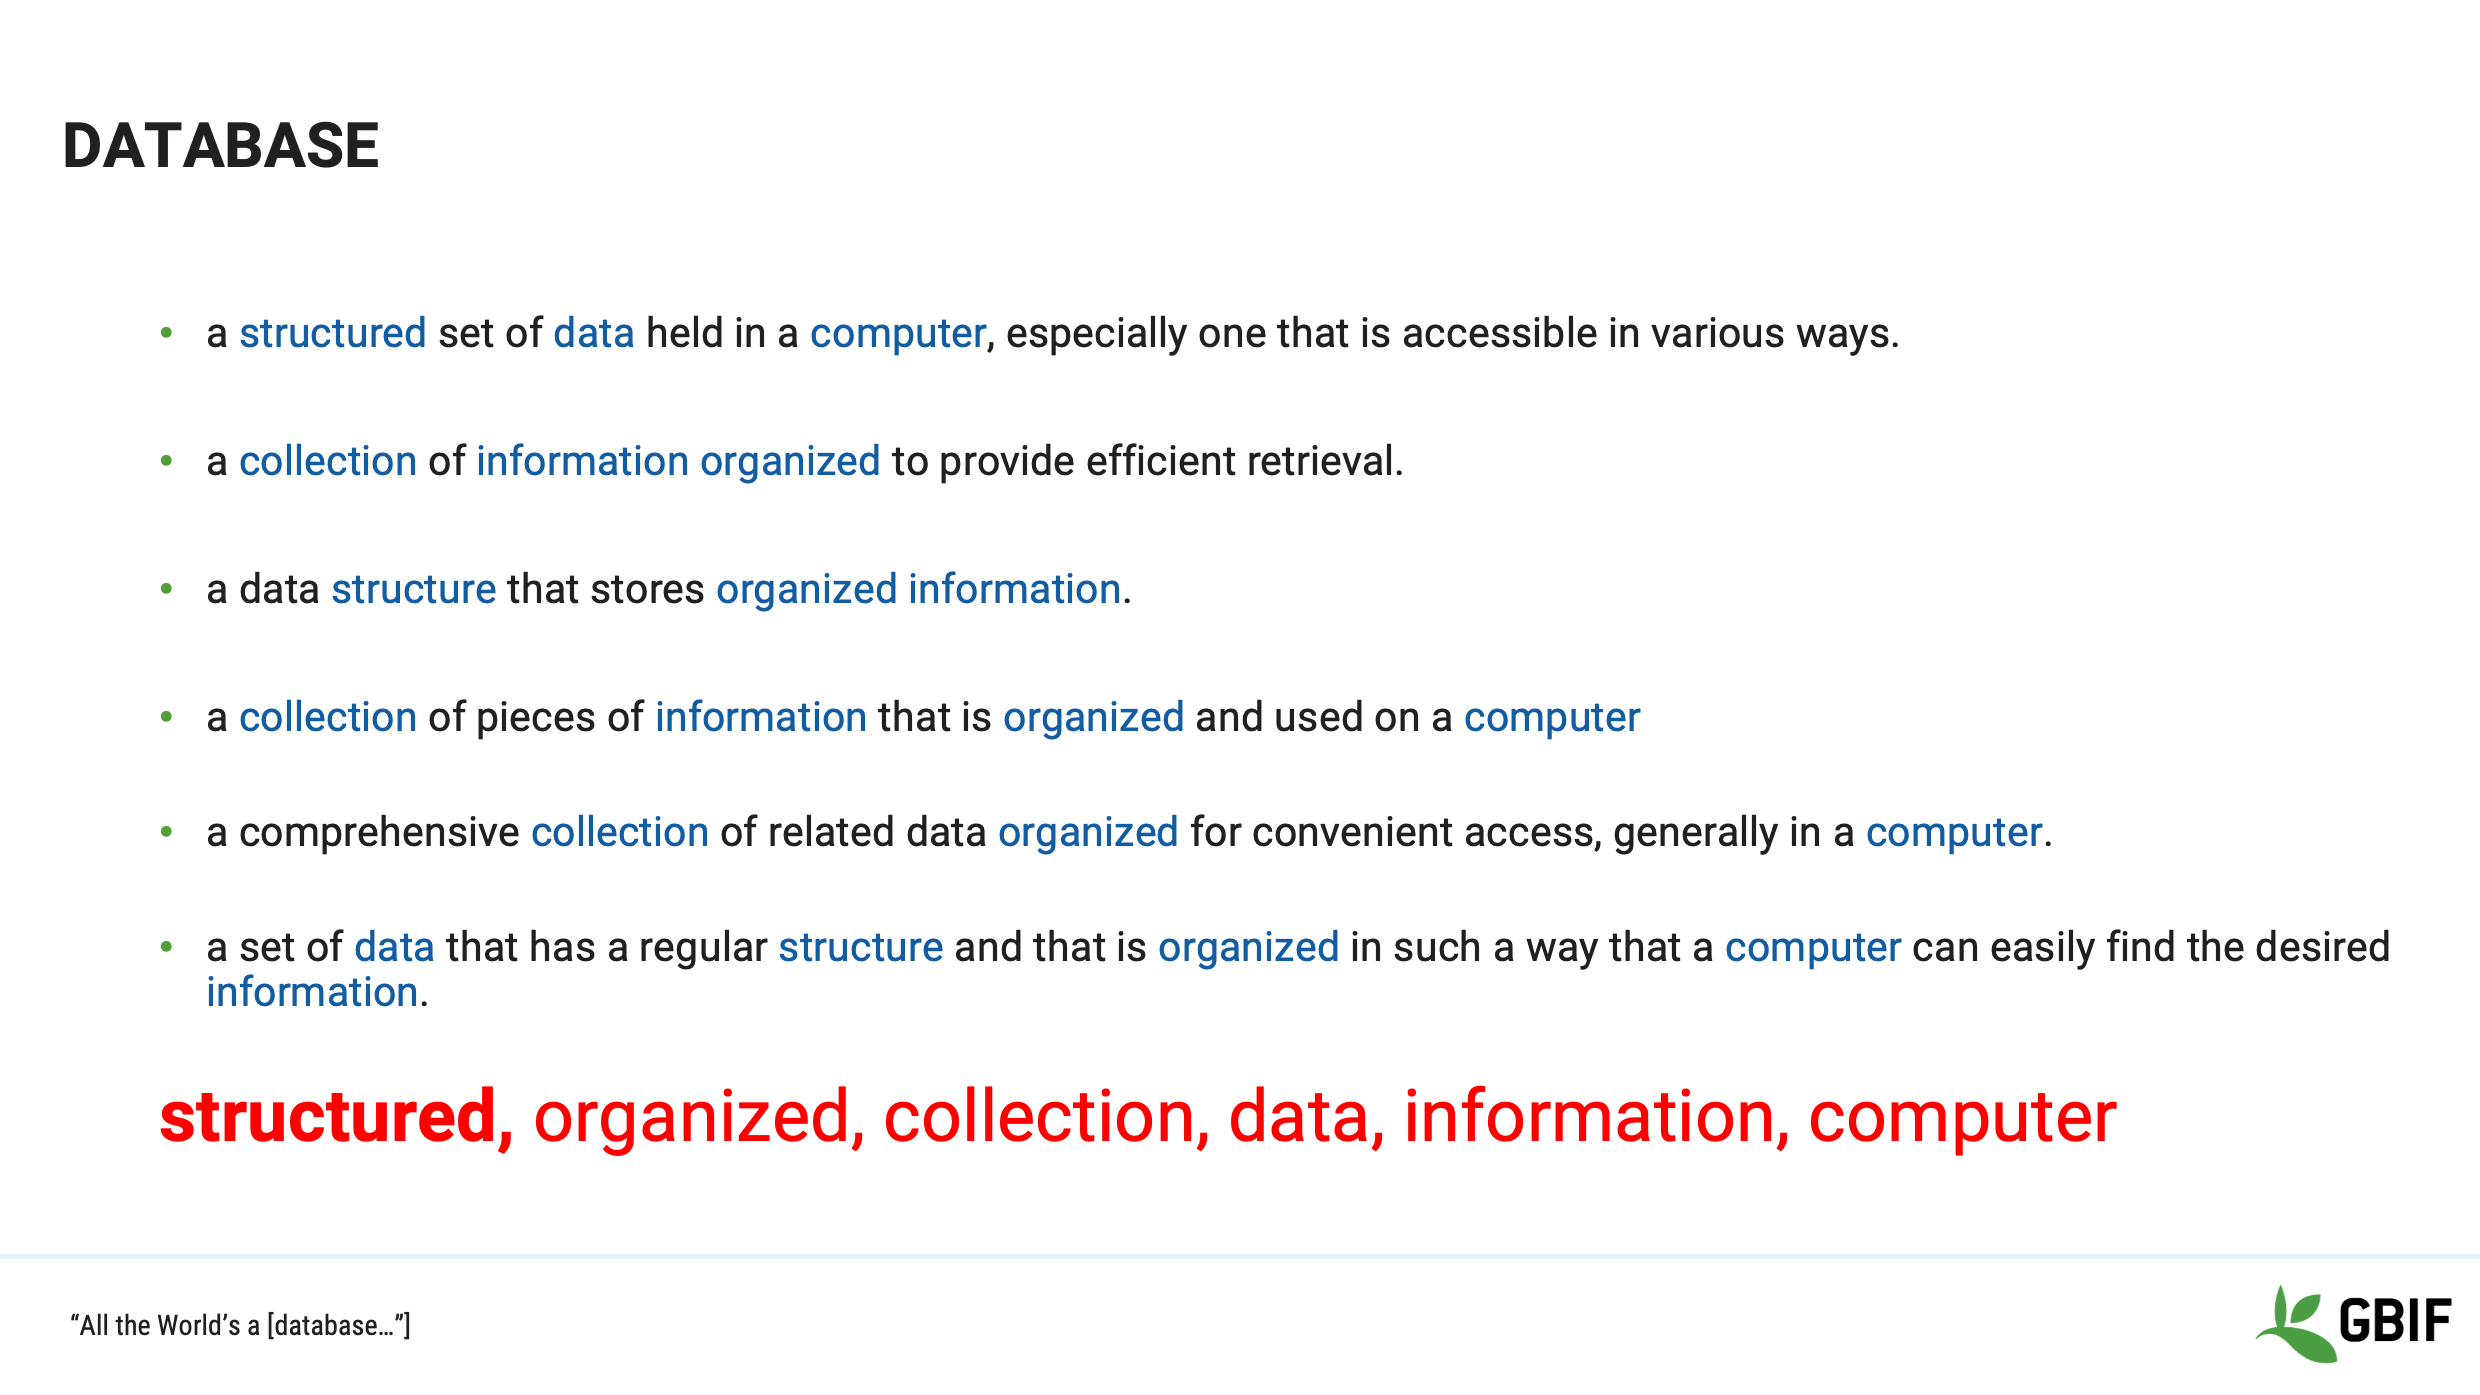
So, what is a “Database”?
-
There are many definitions, but what they all have in common is the theme that a database is a structured and organized collection of data and/or information held on a computer.
-
Everything else in the list is just a way to help you achieve this data nirvana!
-
Let’s dig a little deeper then into those other terms.
Slide 7 - Database language
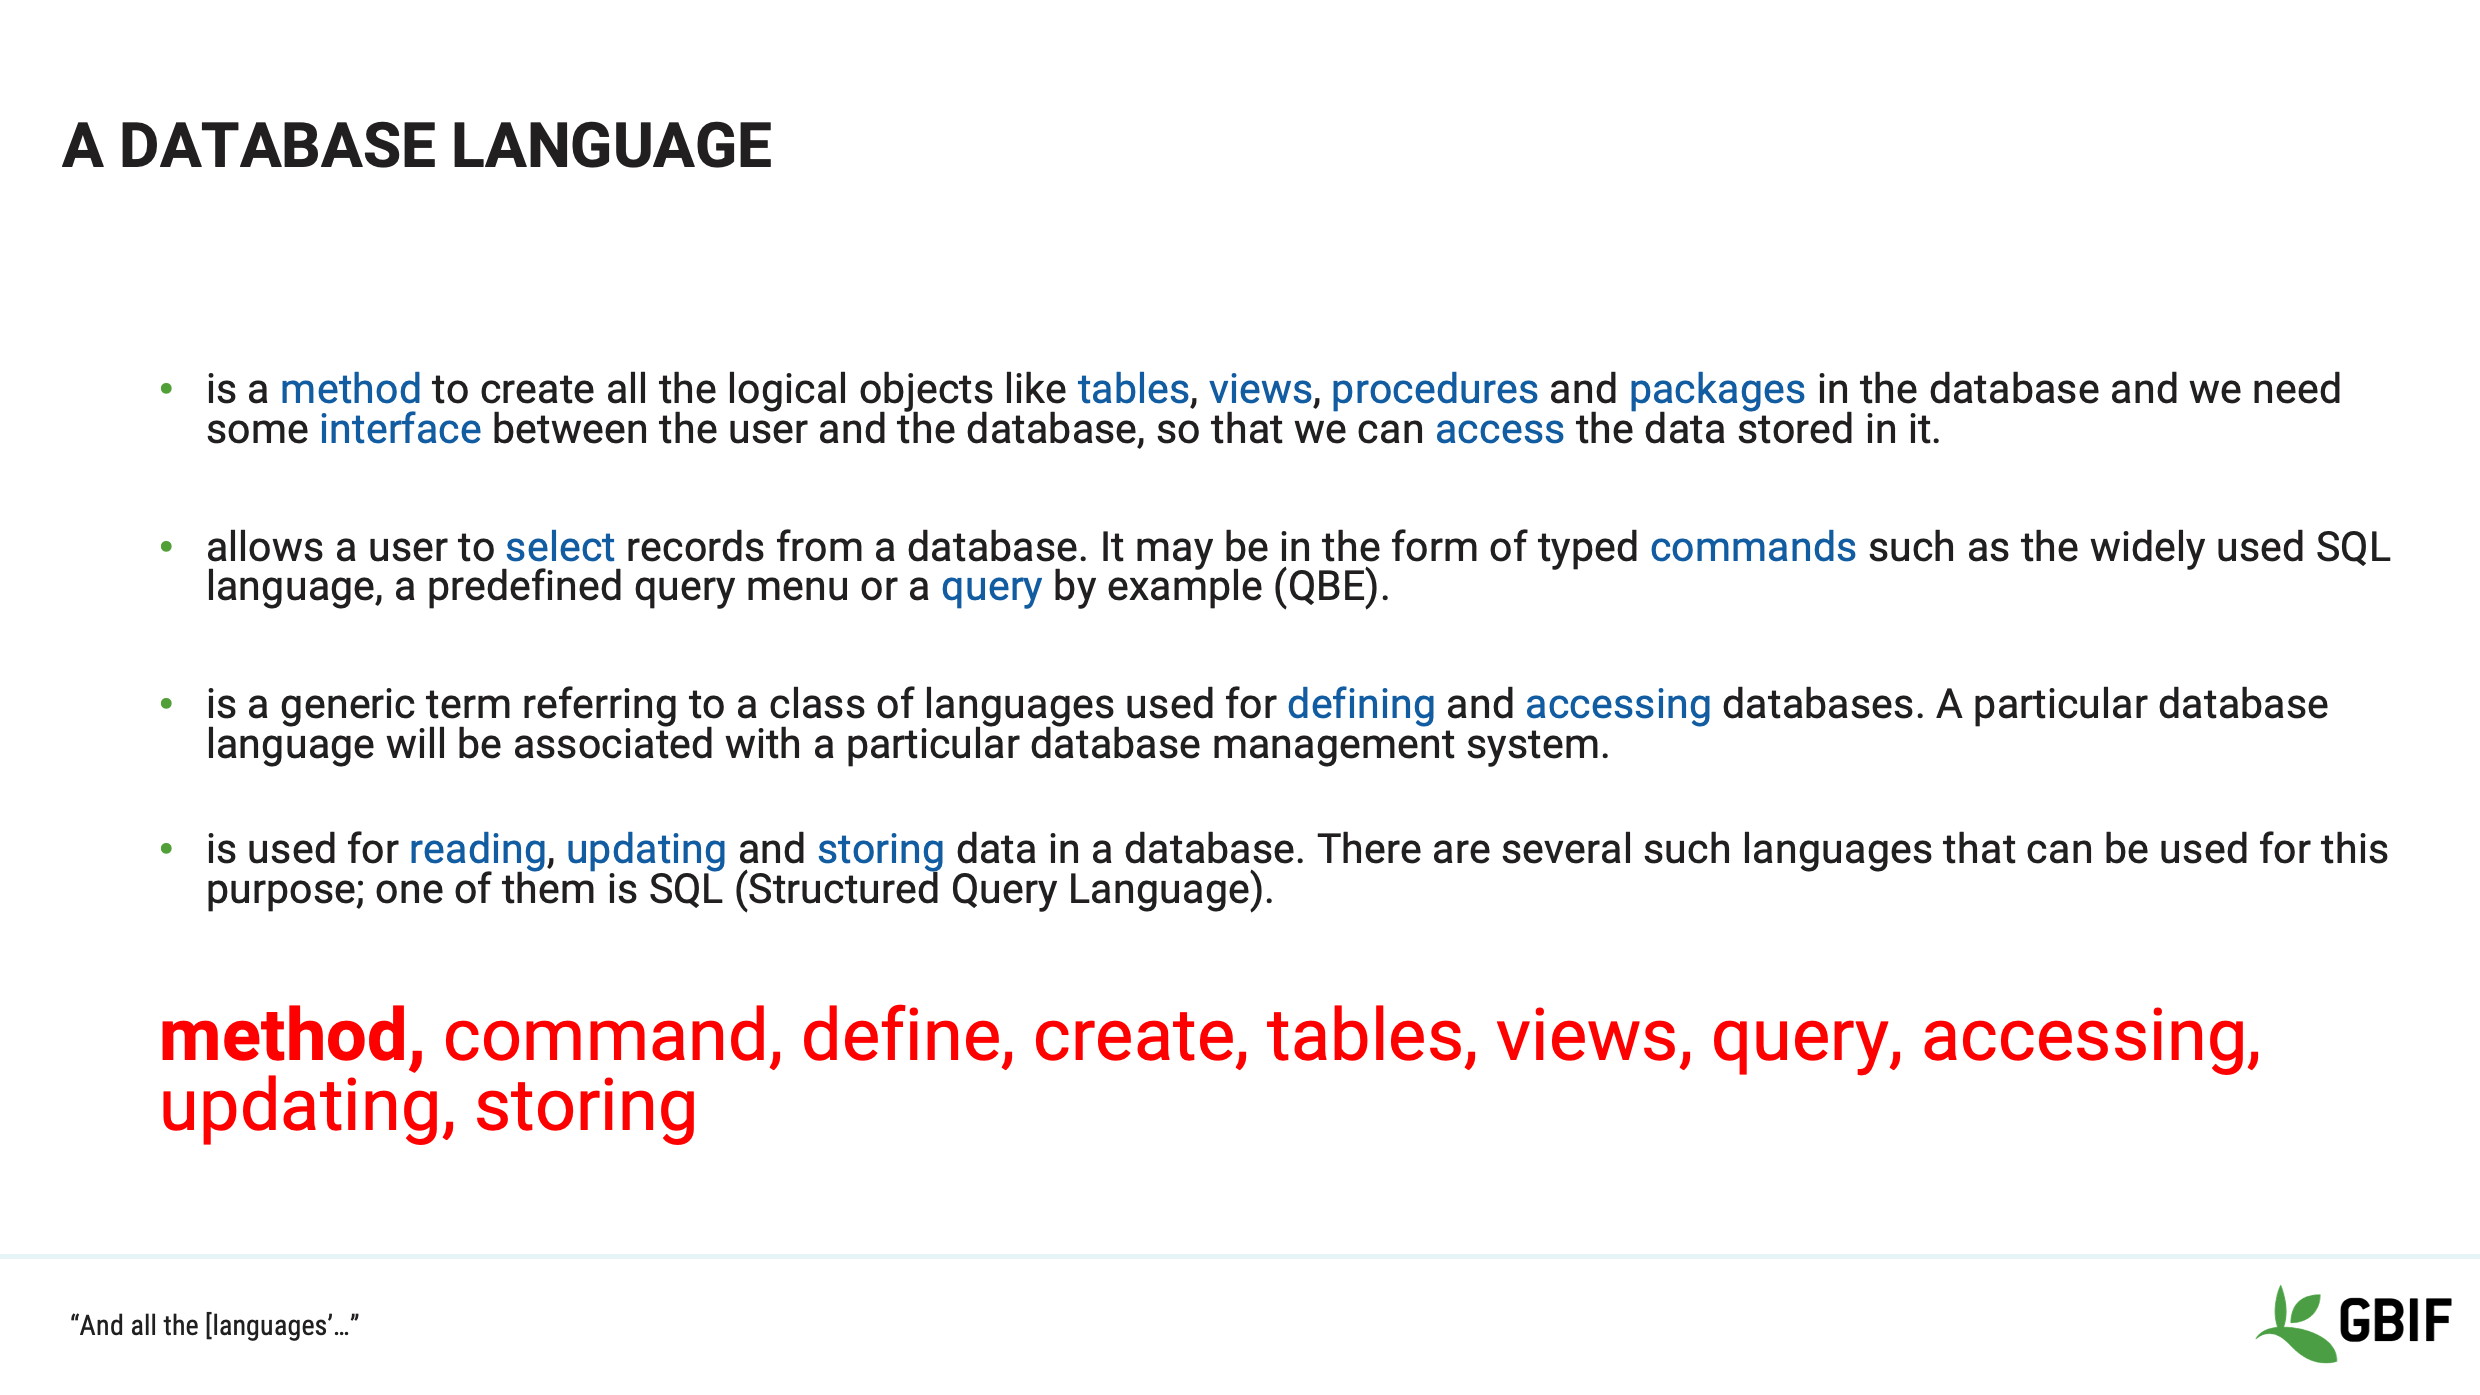
Let us take a look at the phrase “database language”.
According to the Oxford English dictionary “language” is the method of human communication…consisting of the use of words (or symbols) in a structured and conventional way.
For our purposes, database languages and their close allies the array languages are the way by which a human communicates with a computer to manipulate and move around data.
Examples that you may have come across are:
-
Java, SPARQL, SQL and Python
-
They are simply methods used to define and create tables, views and queries and also allow users to access, update, store and move data around.
Slide 8 - Database program/software
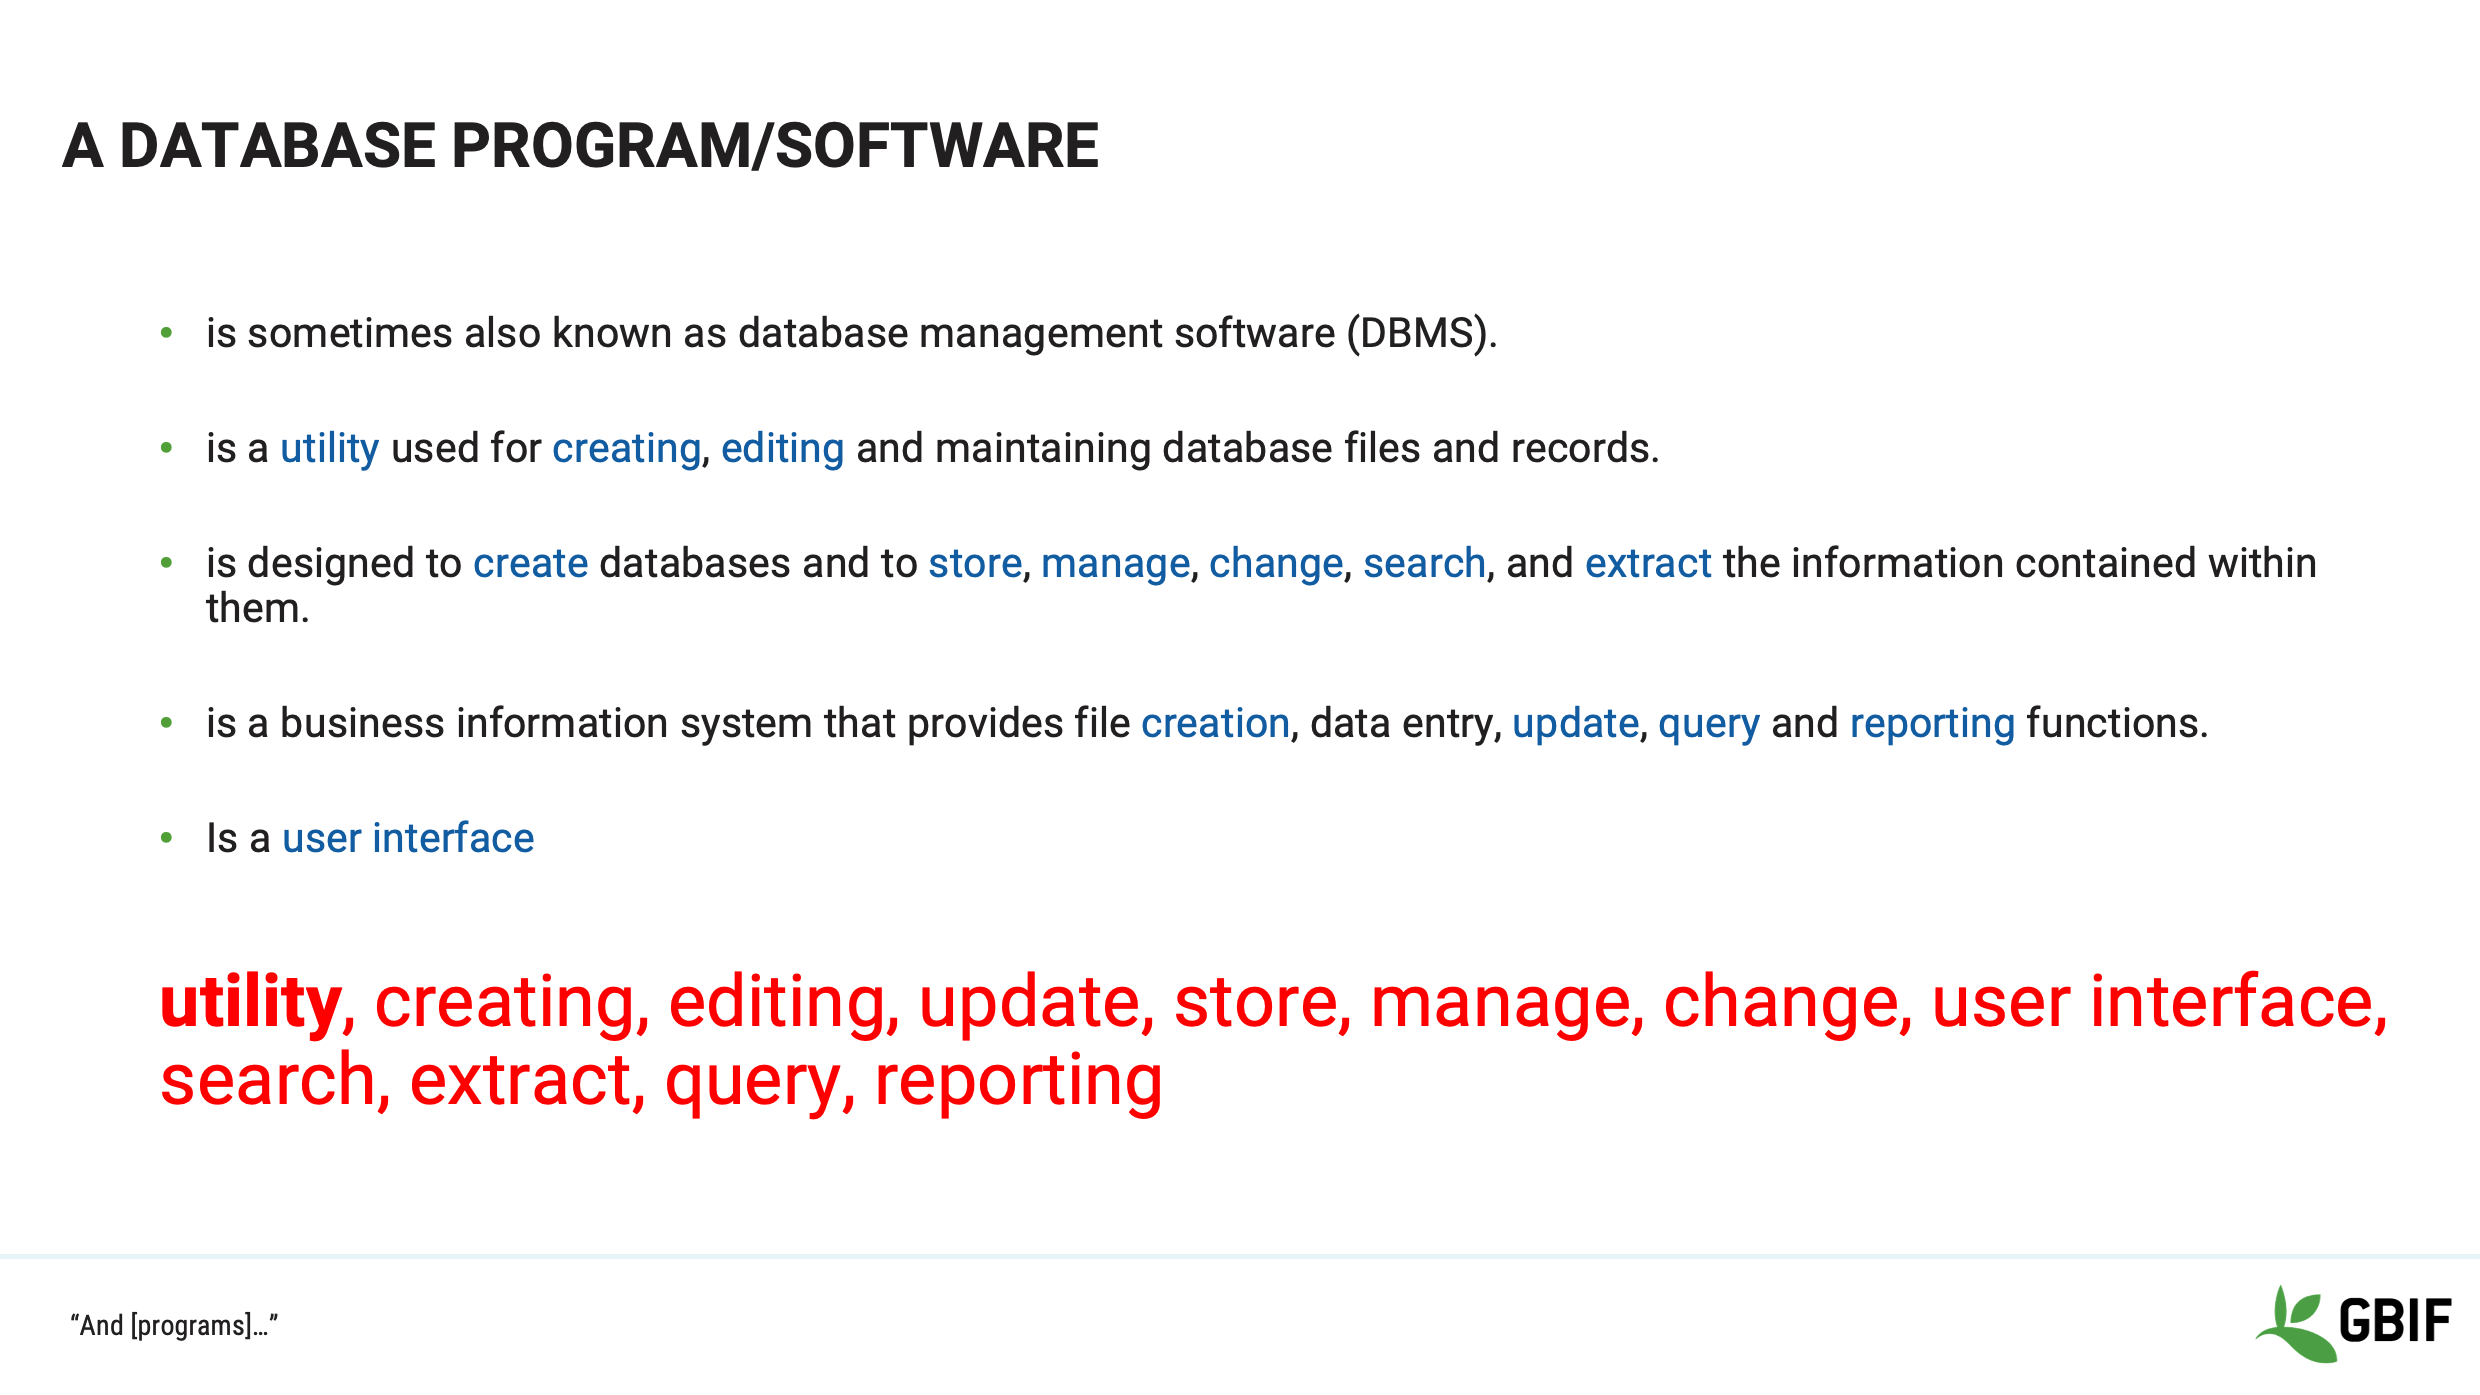
Now let’s look at the phrase “database program or software”.
Again going to the Oxford English dictionary a “program/programme” is a set of related measures or activities with a particular long-term aim.
In this context, a “database program or software” combines and presents functions and features for manipulating data, together is a unified interface.
Examples that you may come across are:
Microsoft Access, FilemakerPro and Oracle
So, database programs or software are grouped utilities which allow a user, via a database language, to store, manage, query and report data held in the system.
Slide 9 - Data cleaning tool
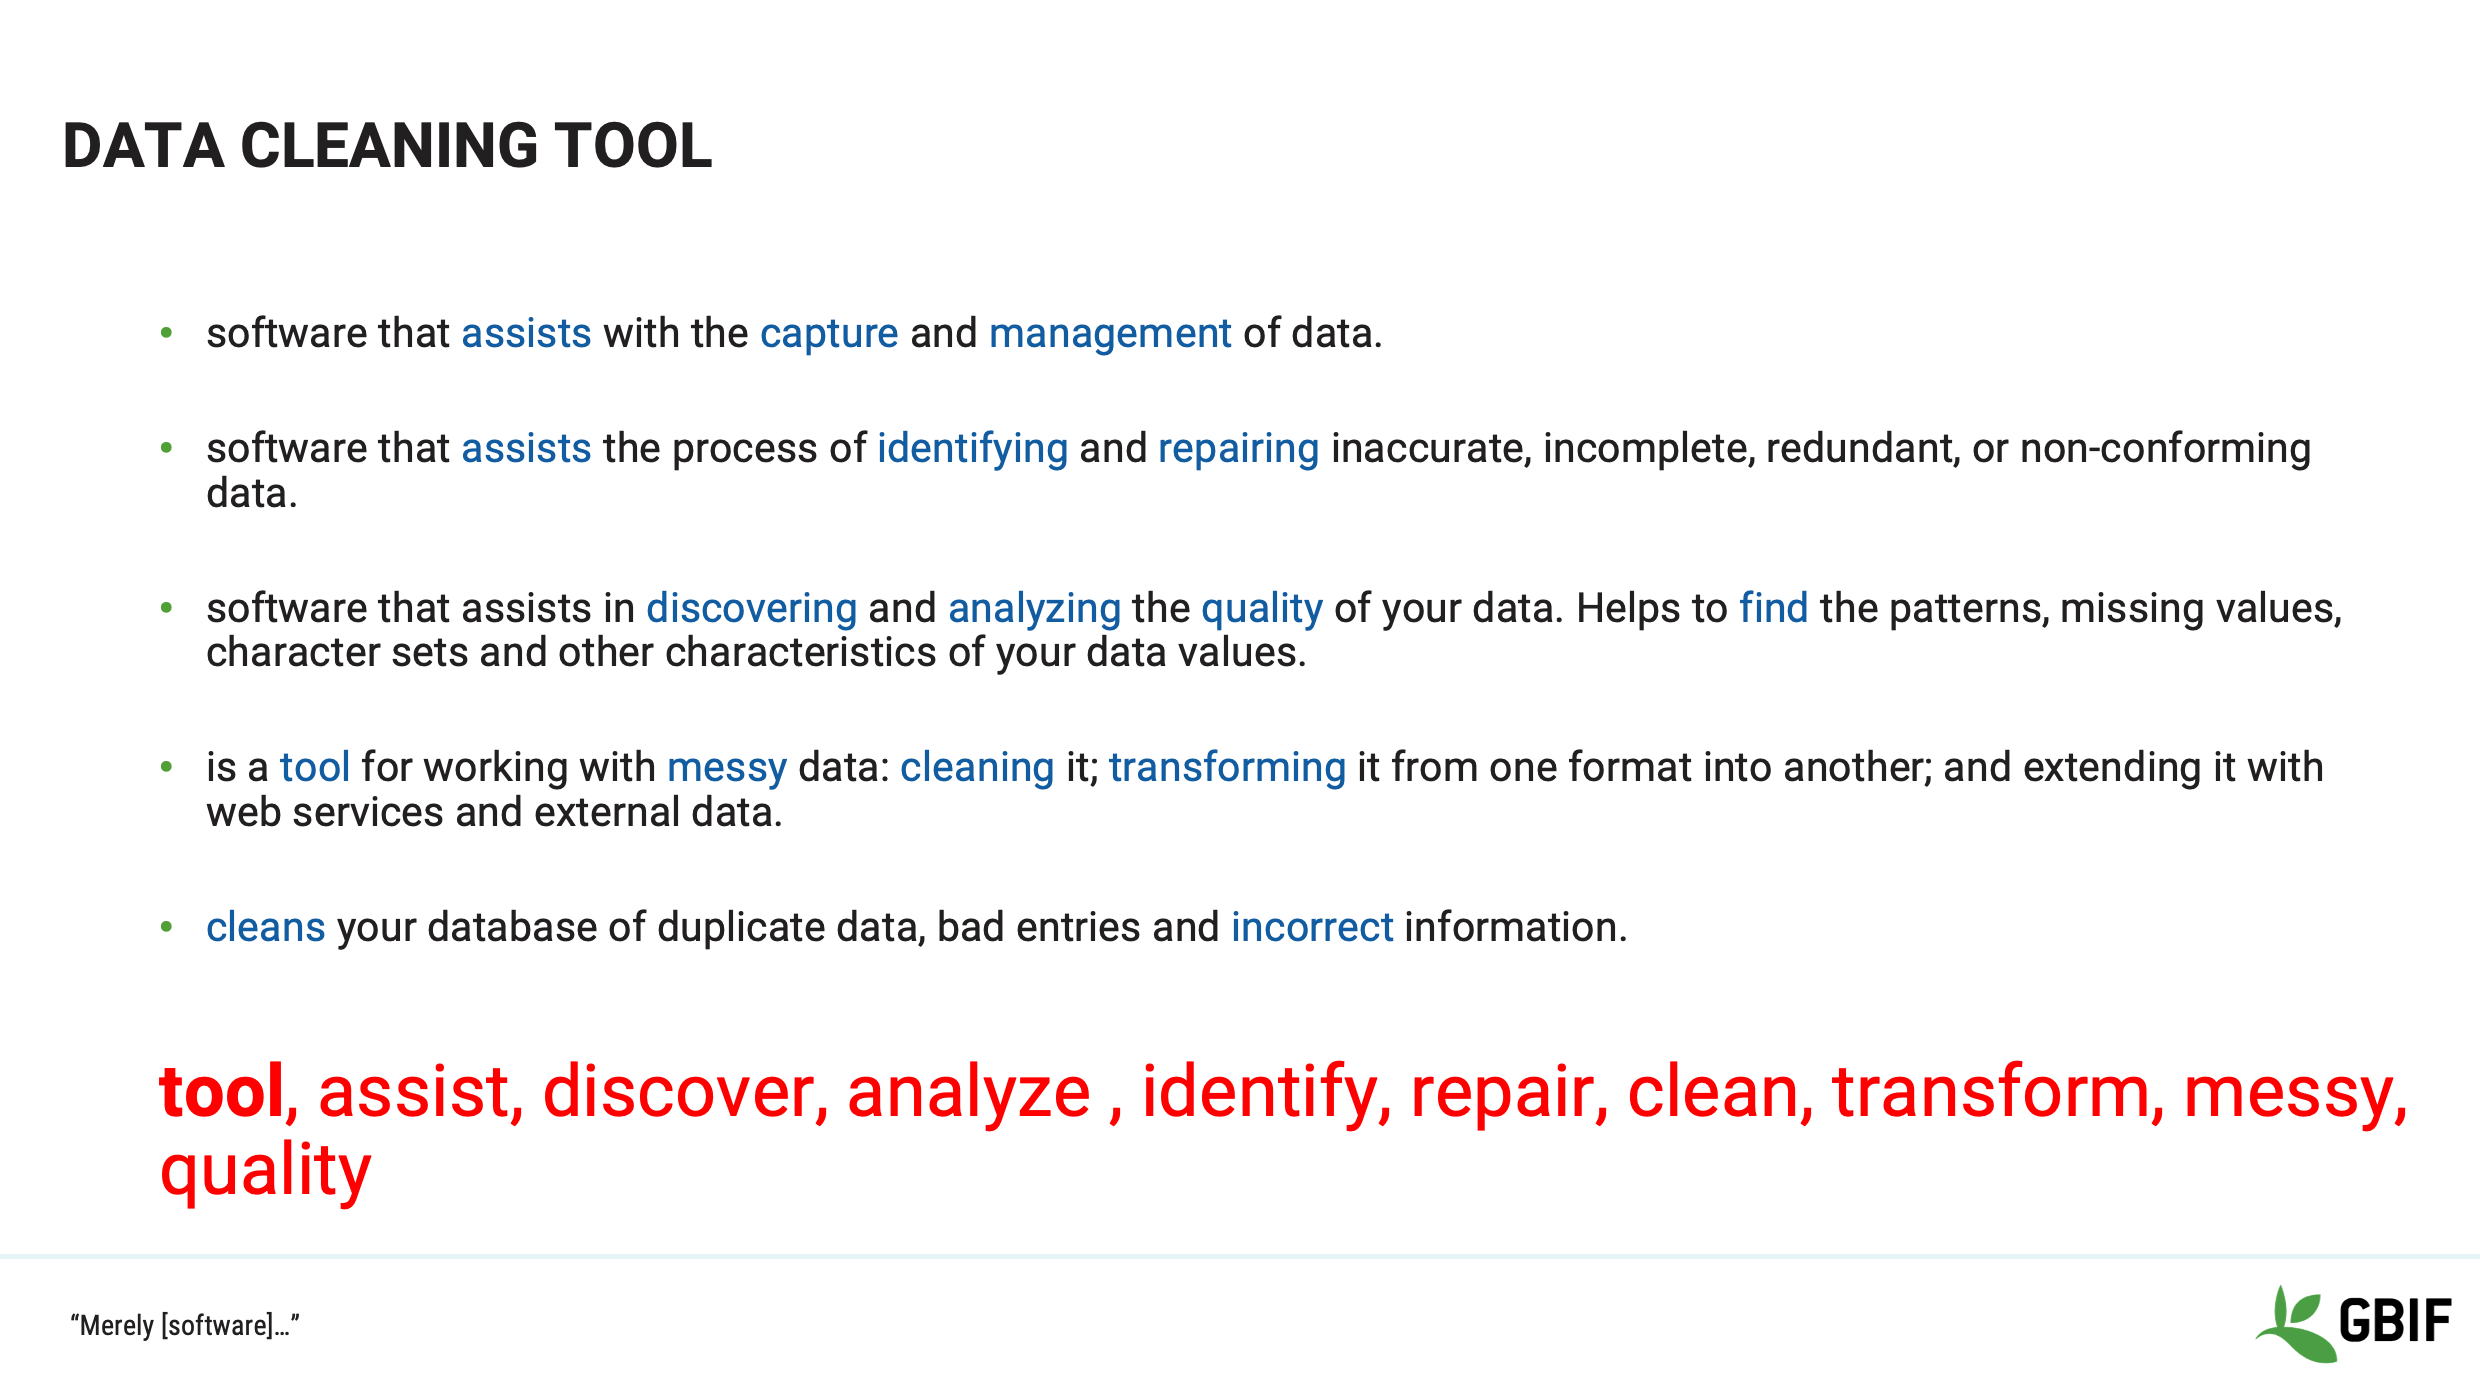
The last term is “data cleaning tool”.
Data cleaning tools are systems whose utilities focus is on the manipulation of data with the aim of increasing fitness for use.
Examples that you may be familiar or will learn about during the course are:
OpenRefine, MatLab and spreadsheets
A data cleaning tool should assist the user in the discovery and repair of messy data in order to increase quality.
Slide 10 - Definitions - a rose by any other name
Continuing on with some more terms that you should be familiar with we will look at the differences between the terms Field, Label and List.
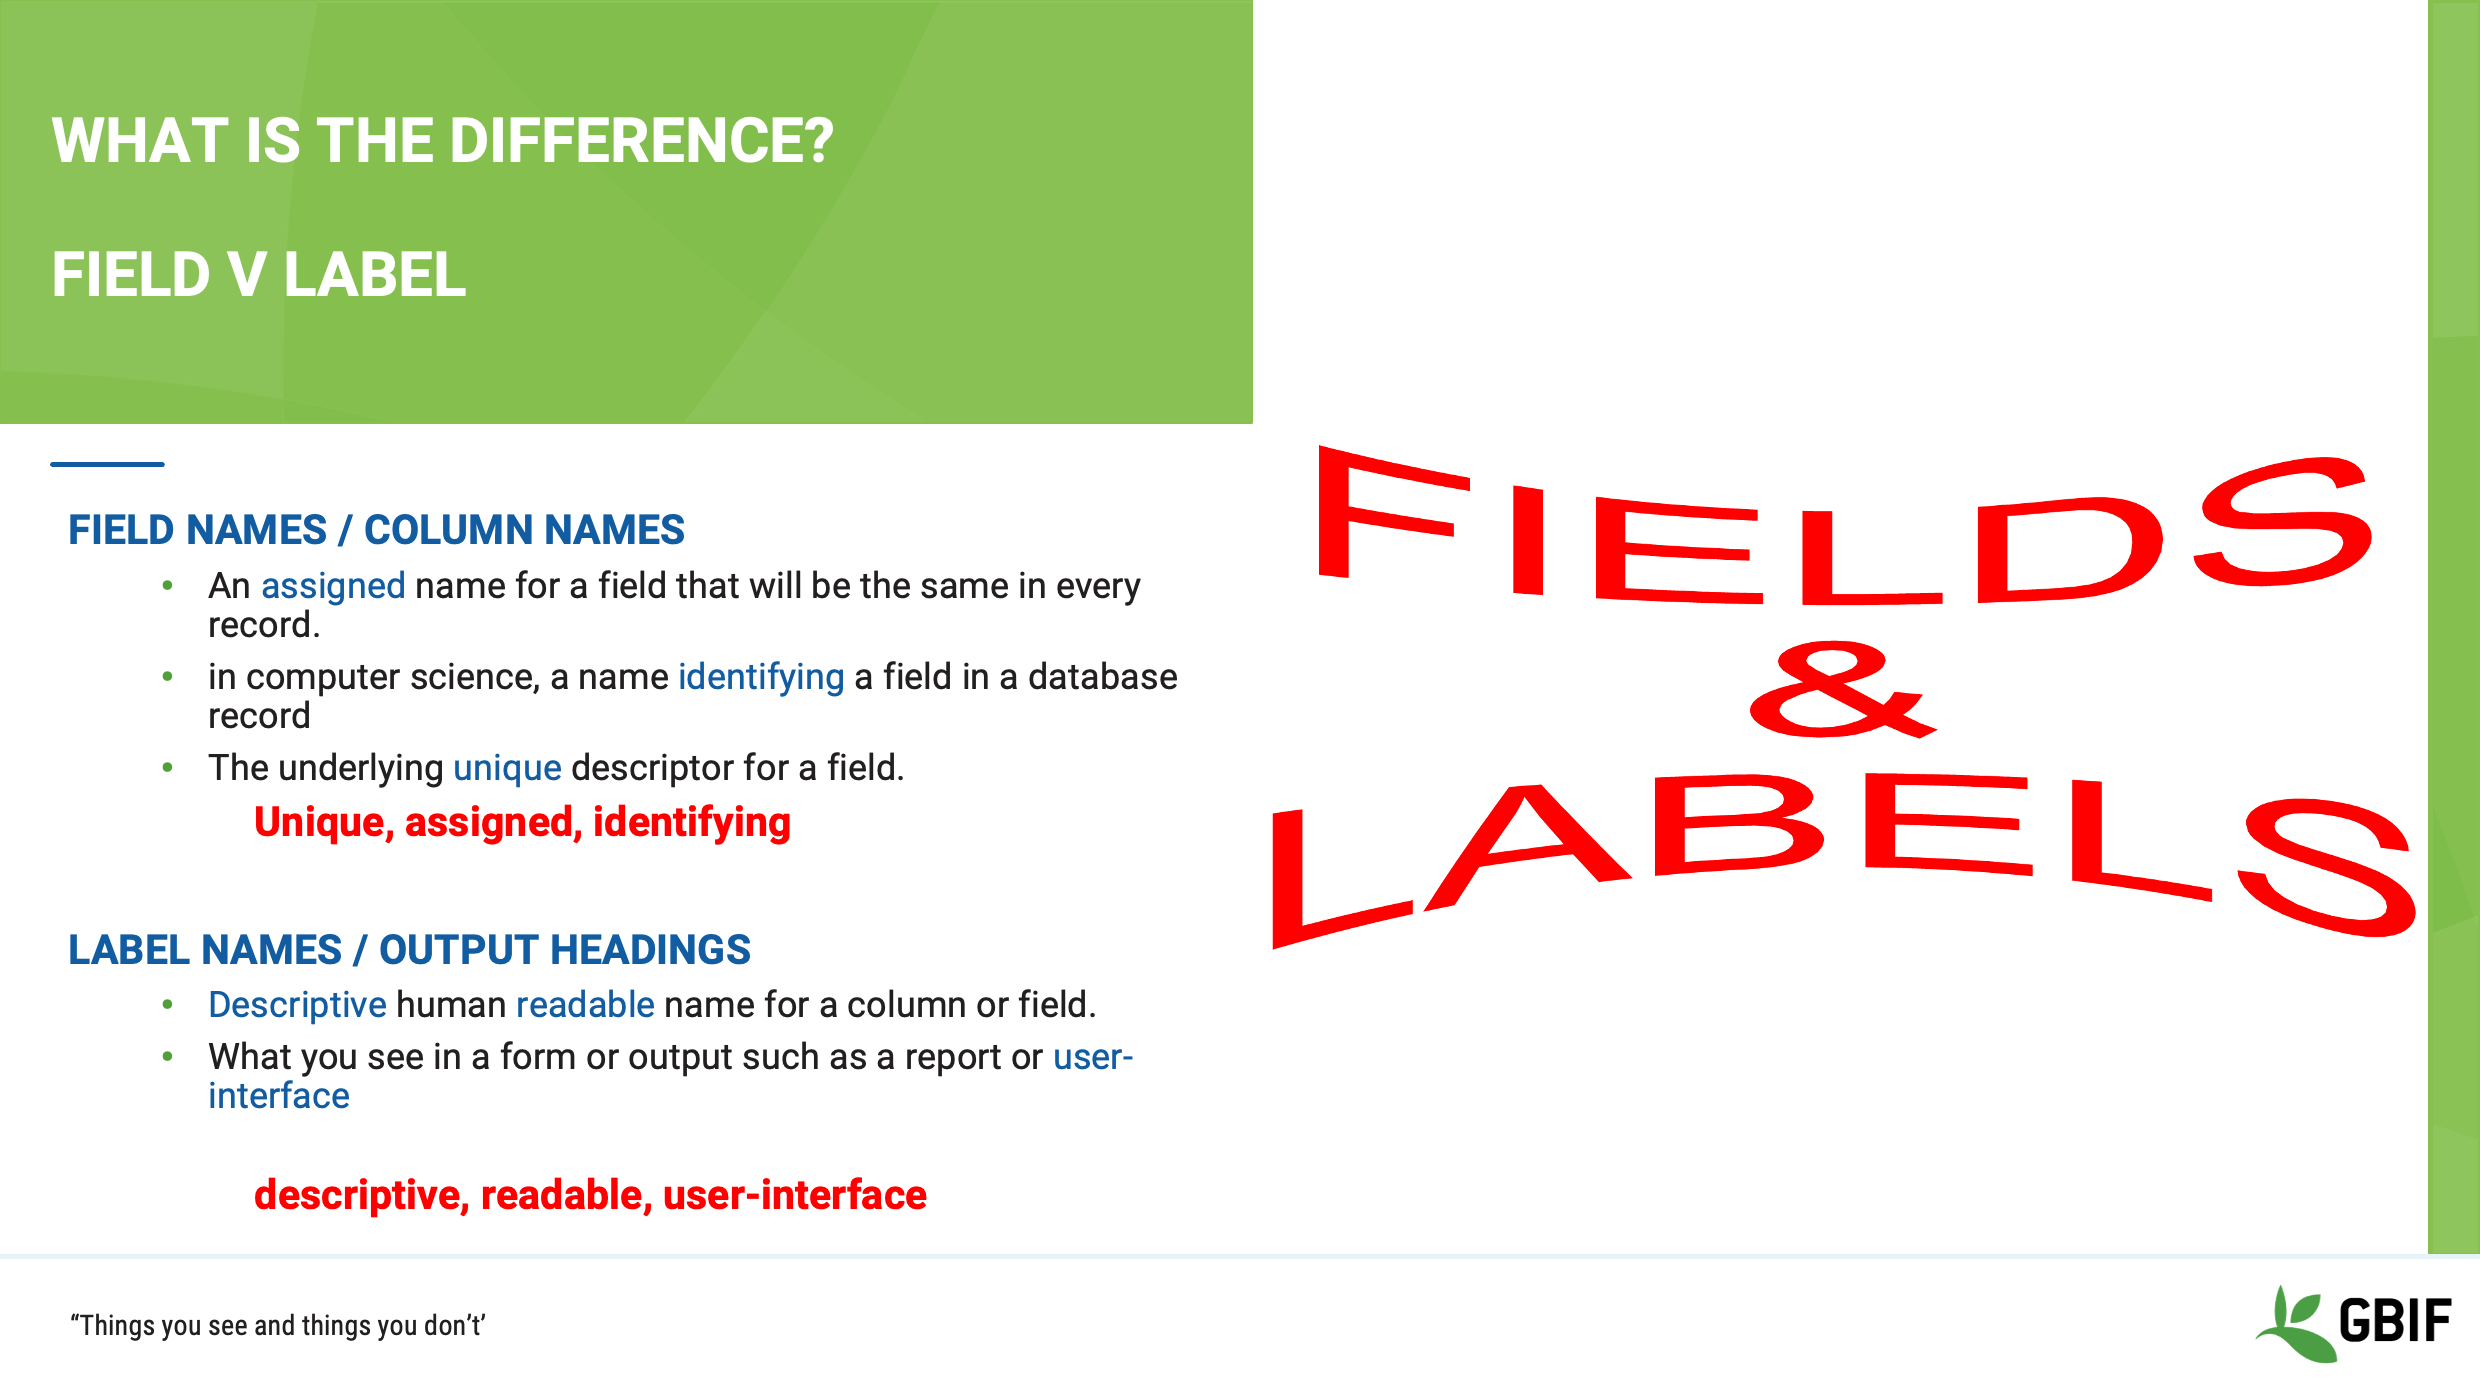
Slide 11 - Field vs label
You will often hear reference made to field or column names and field labels or headings. Often they will be used interchangeably, however they are different things.
Field or column names refer to the actual column in the database table. They are a often short, not always in plain language, sometimes computer generated; but in a properly formed database they are ALWAYS unique. Field names are almost always used by database languages, because the avoid ambiguity.
Labels and headers on the other hand, refer to the human readable versions of the field names. Most often you will see these in the graphical user interface of your software and on exports and reports. In some software you can in fact have different labels to the same field on a user by user or group basis!
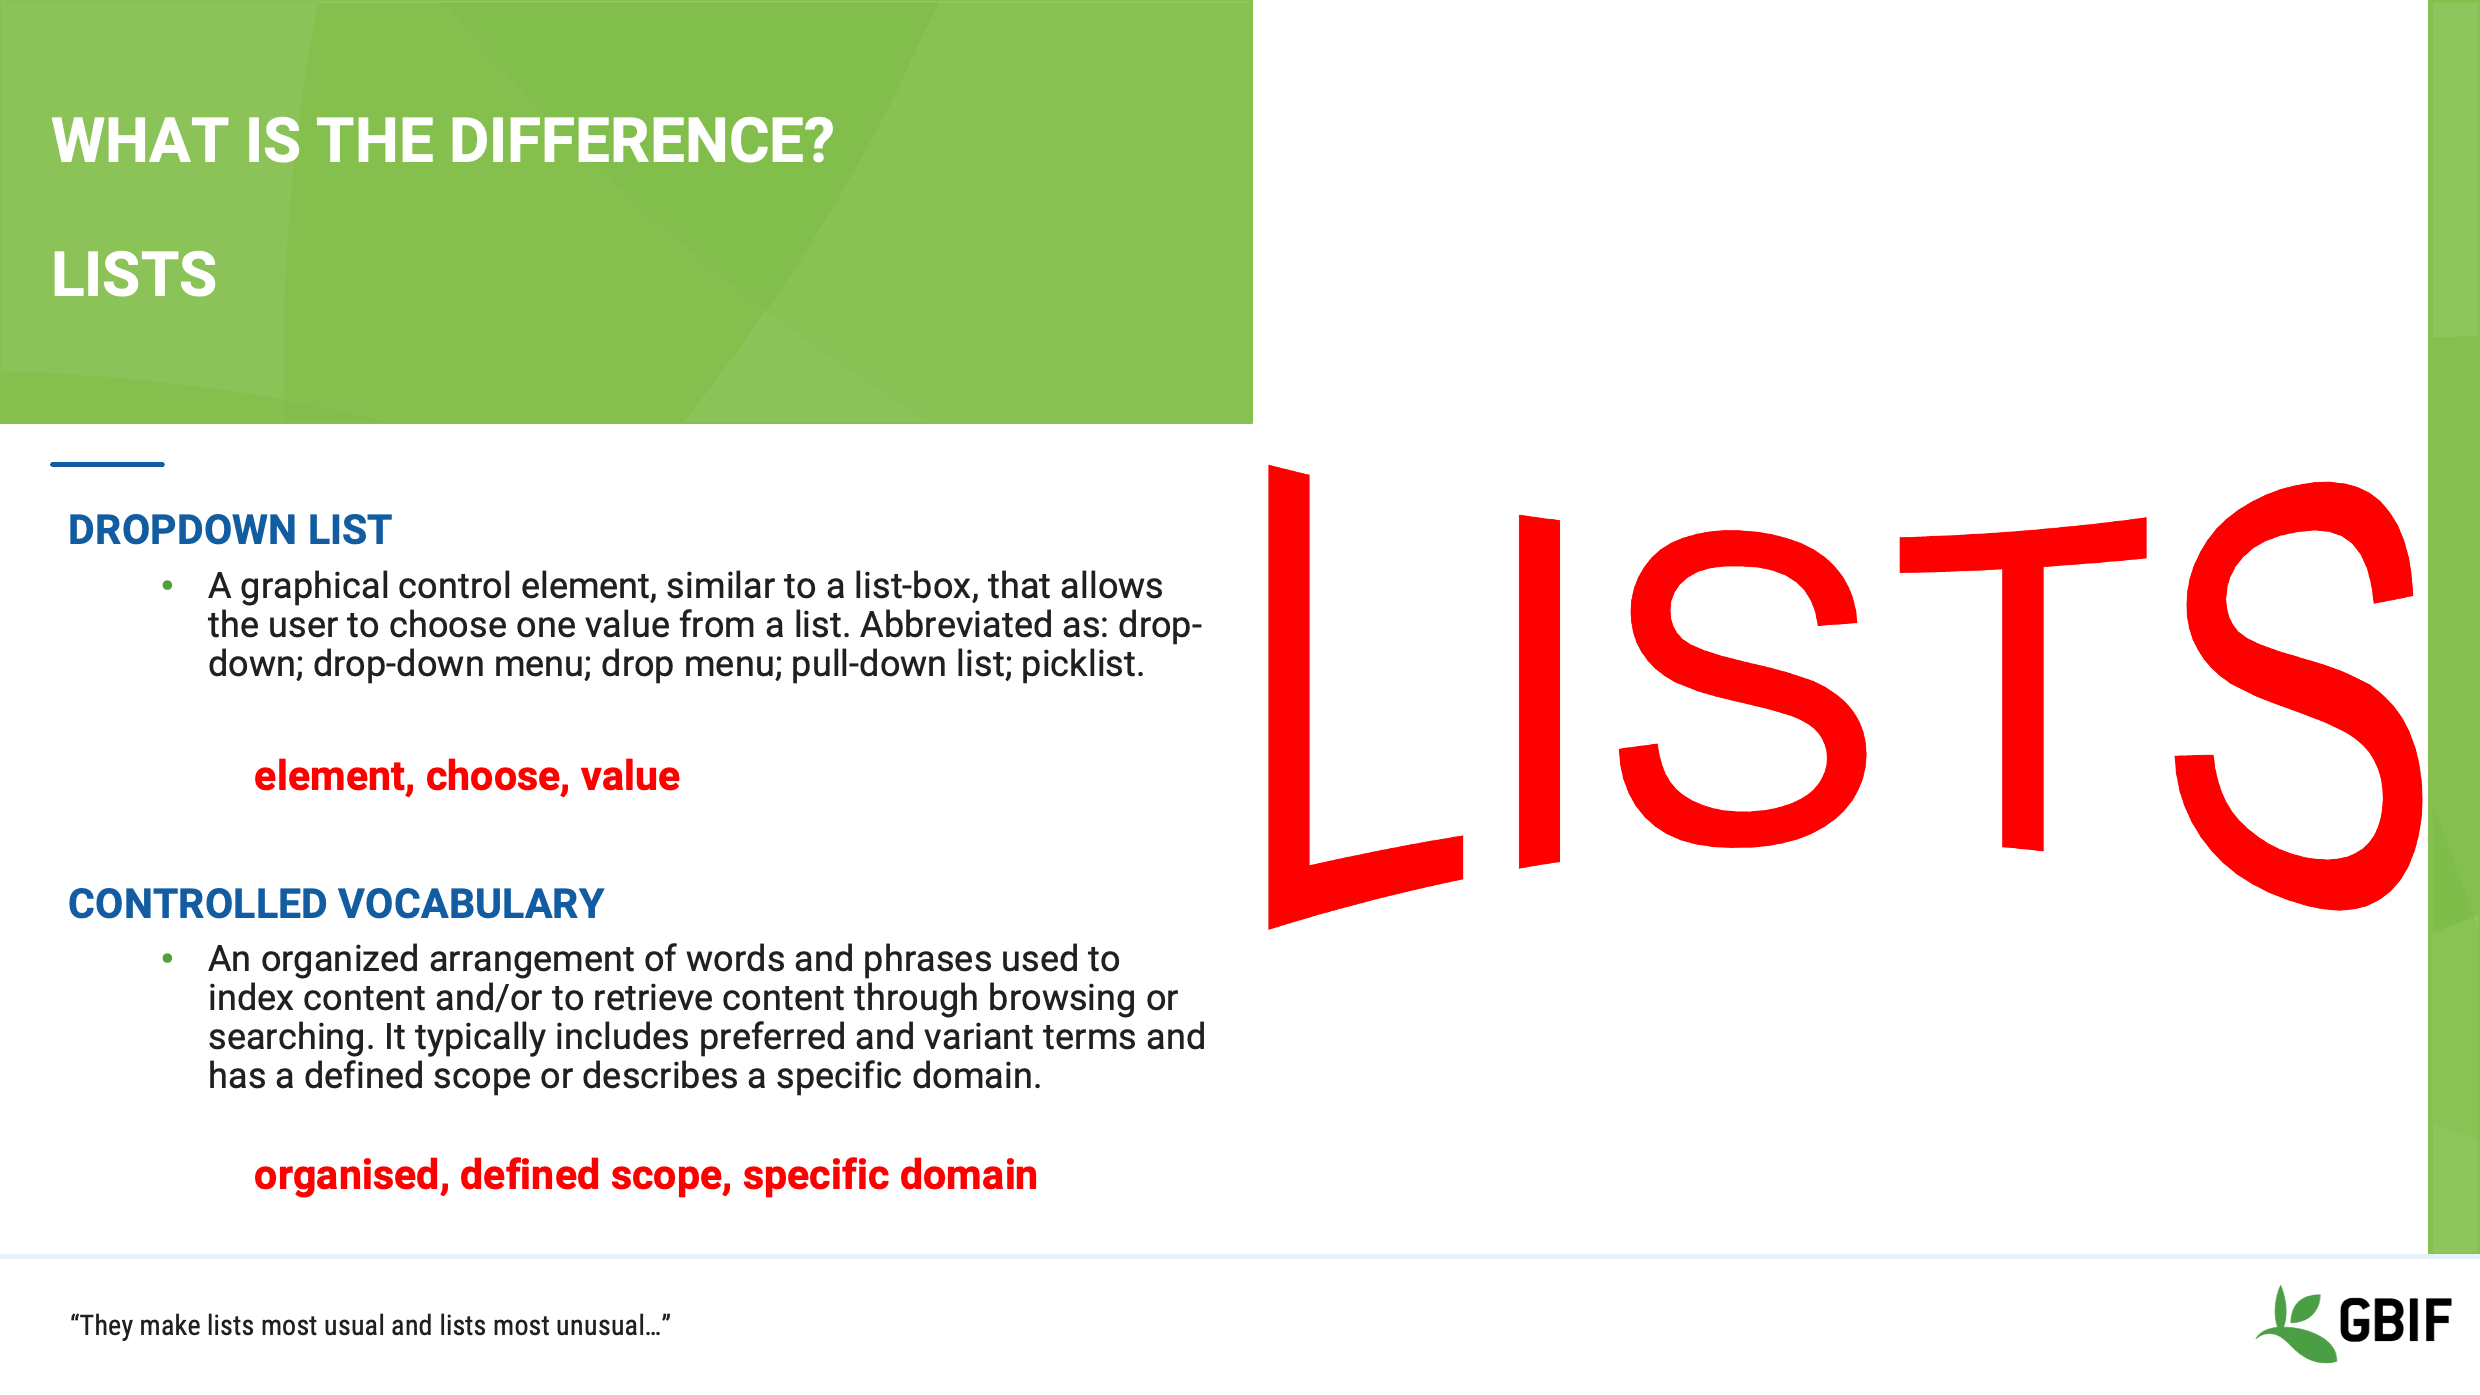
Slide 12 - Lists
As you work with your data you will come across the phrases “drop-down list” and “controlled vocabulary” and on the surface they can appear to be the same. Indeed they are both powerful tools to help you keep your data clean, but they are different.
A drop-down list, also sometimes called a lookup table is a data entry element that is created in your database software. It allows to you select a value from a predefined set of options. They can also be generated from the data itself on the fly.
A controlled vocabulary on the other hand, is a very strictly defined, domain specific set of values that should be applied to a particular field. They are an integral part of a well defined standard. Such values can be used in a drop-down list as mentioned previously.
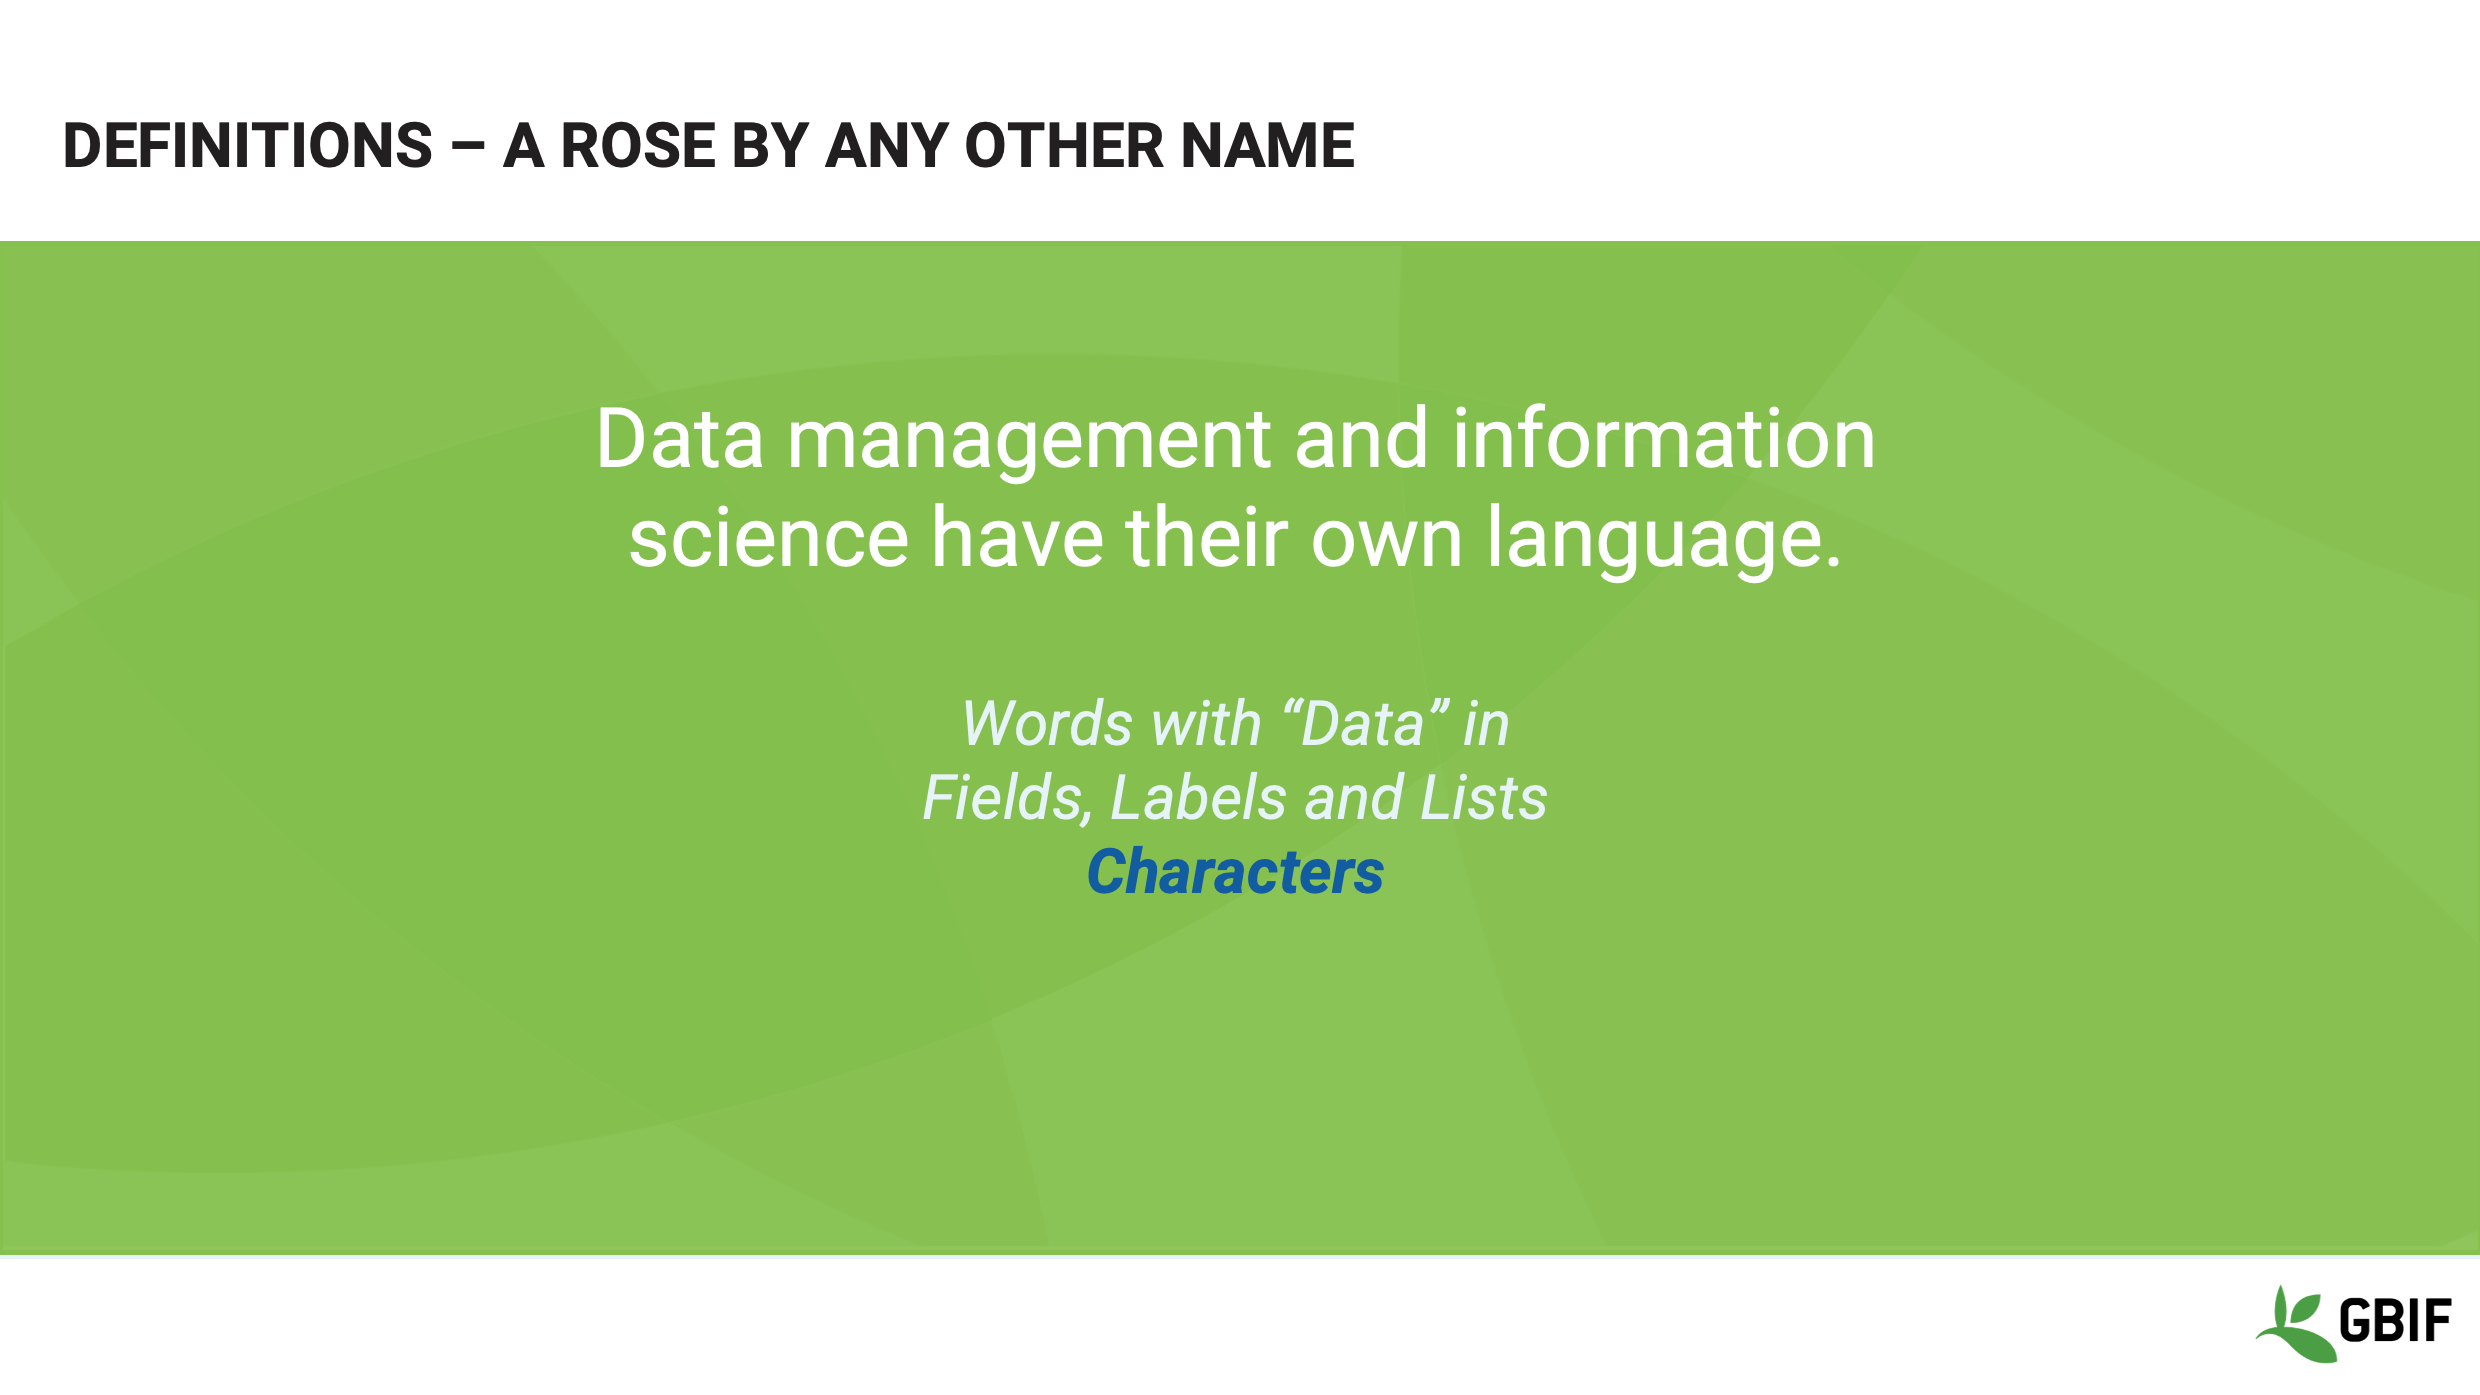
Slide 13 - Definitions - a rose by any other name
In this section we will look at what the term character means in relation to data and computers.
Slide 14 - Characters
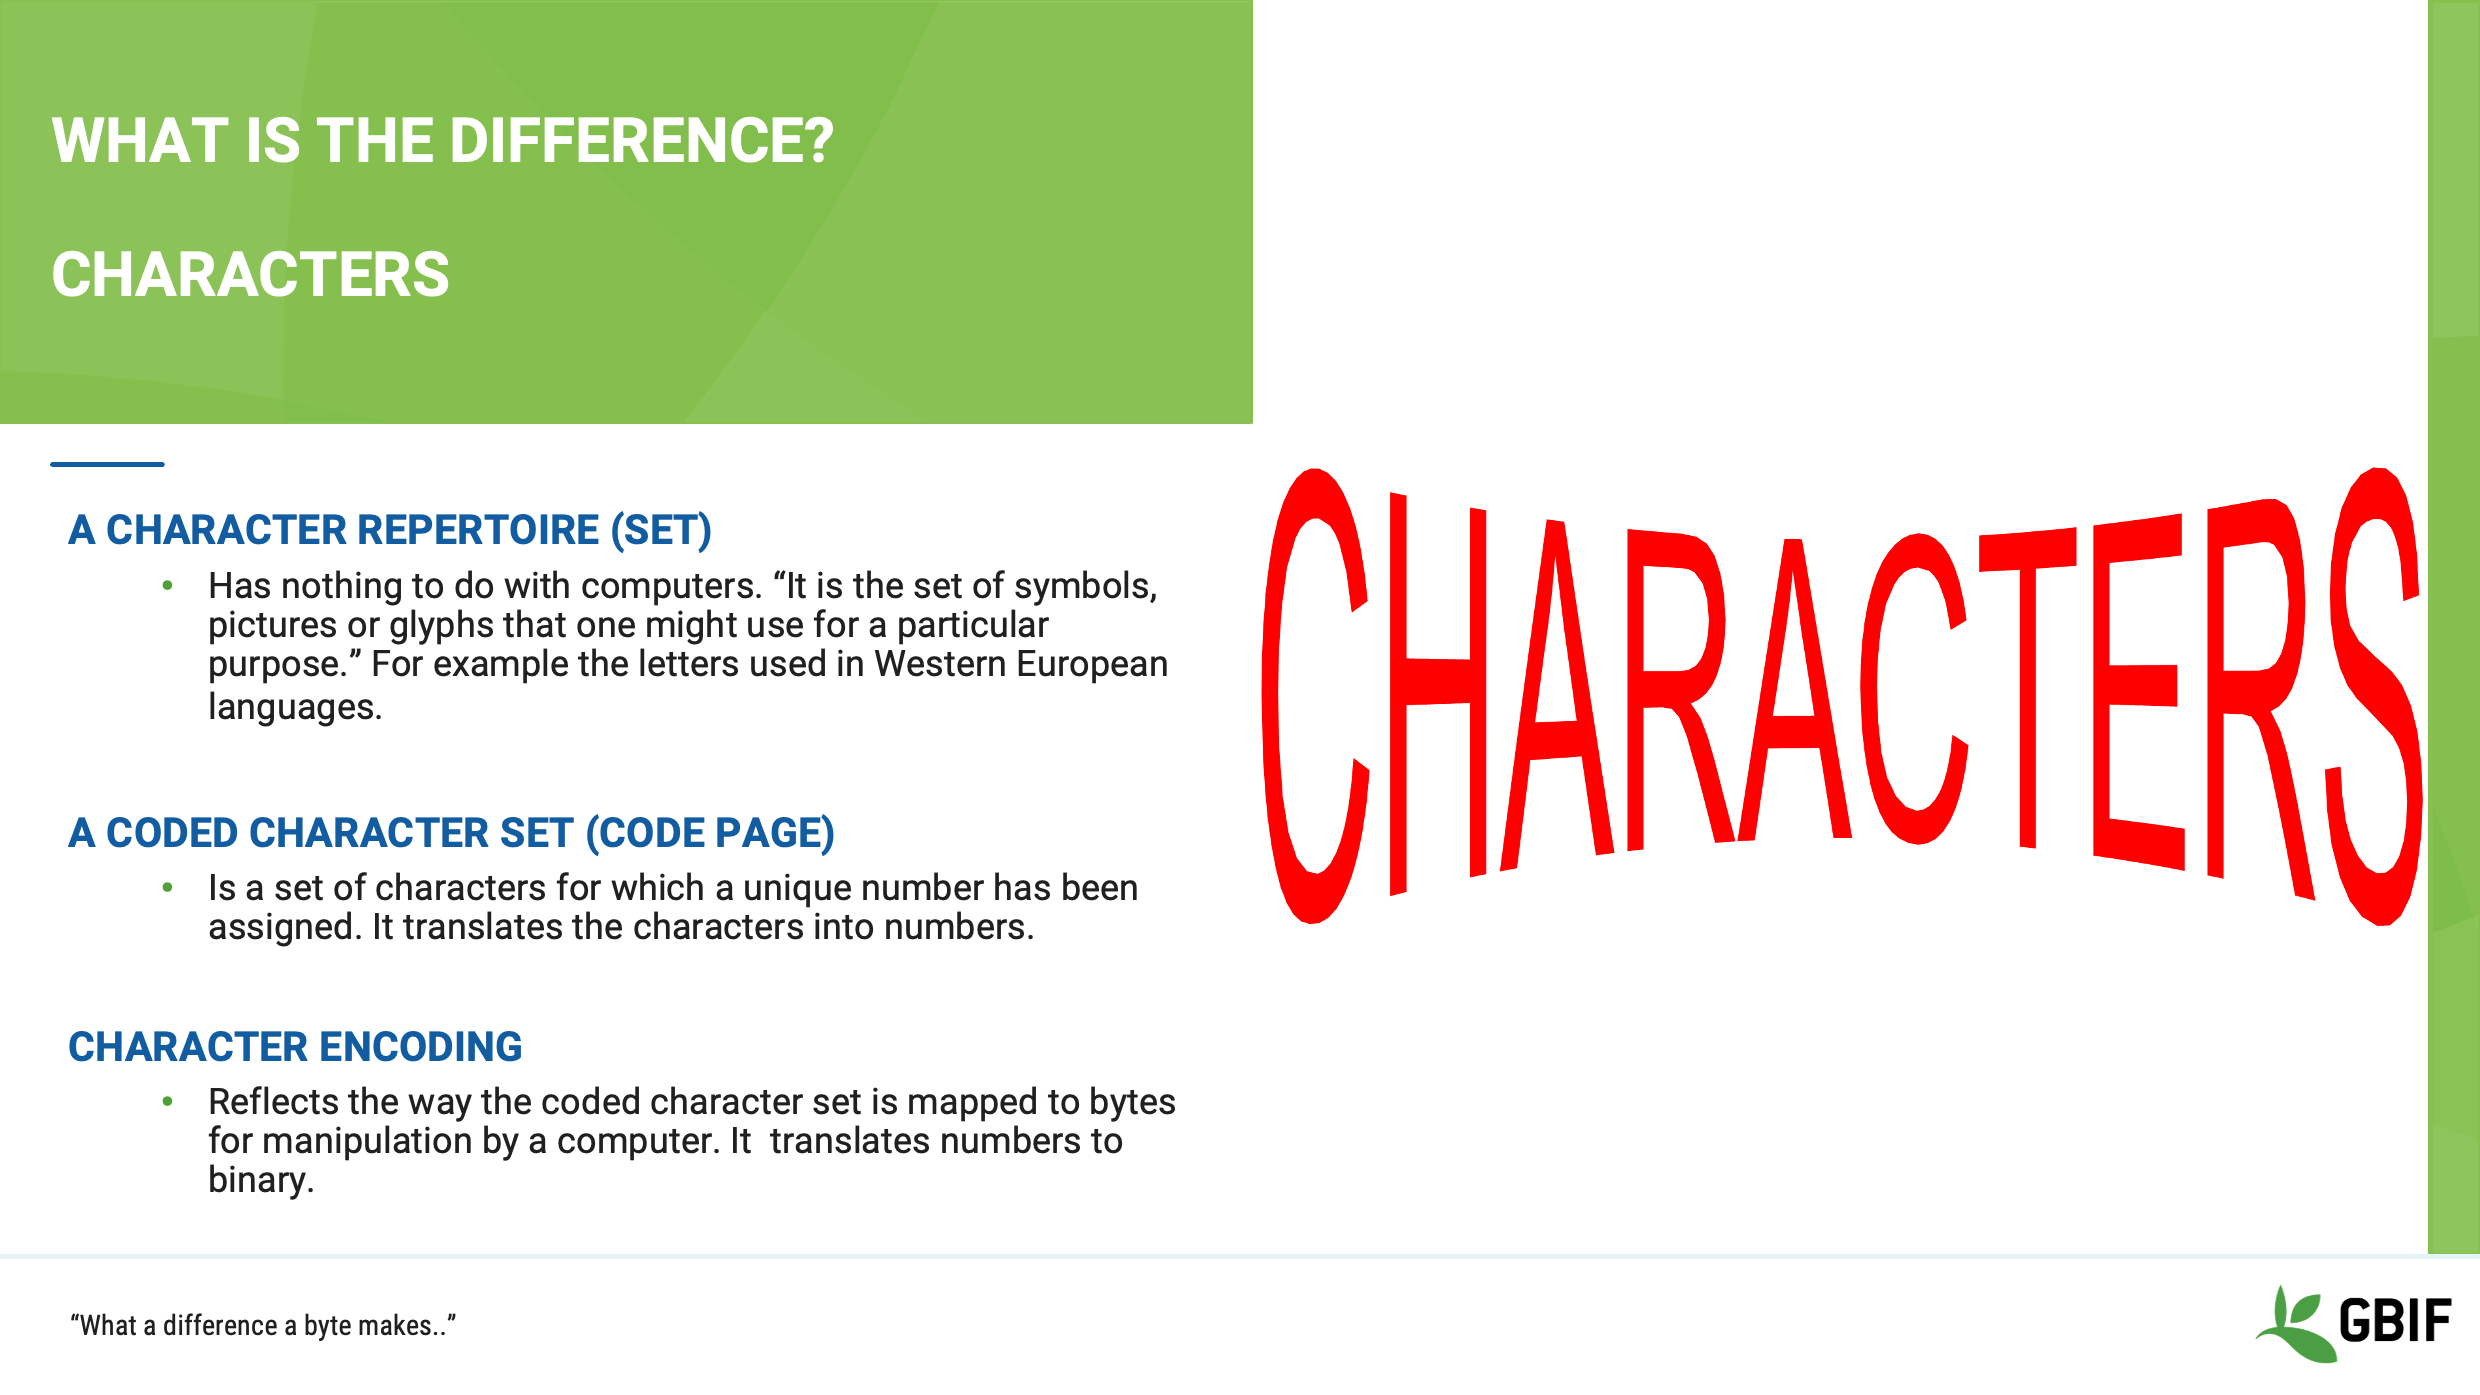
As a reminder computers “see” in binary. Everything that you type in, is held in memory as a series of ones and zeros.
The computer does not “see” the repertoire of letters and symbols on your keyboard. It needs a map to translate the character set that you would write or type, into its binary language and then back again to show it to you on the screen or a printer.
This map is made up of two parts:
The “coded character set”
and
The “character encoding”
Each symbol or glyph is assigned a numeric value and that number is then converted to binary.
Slide 15 - Characters example
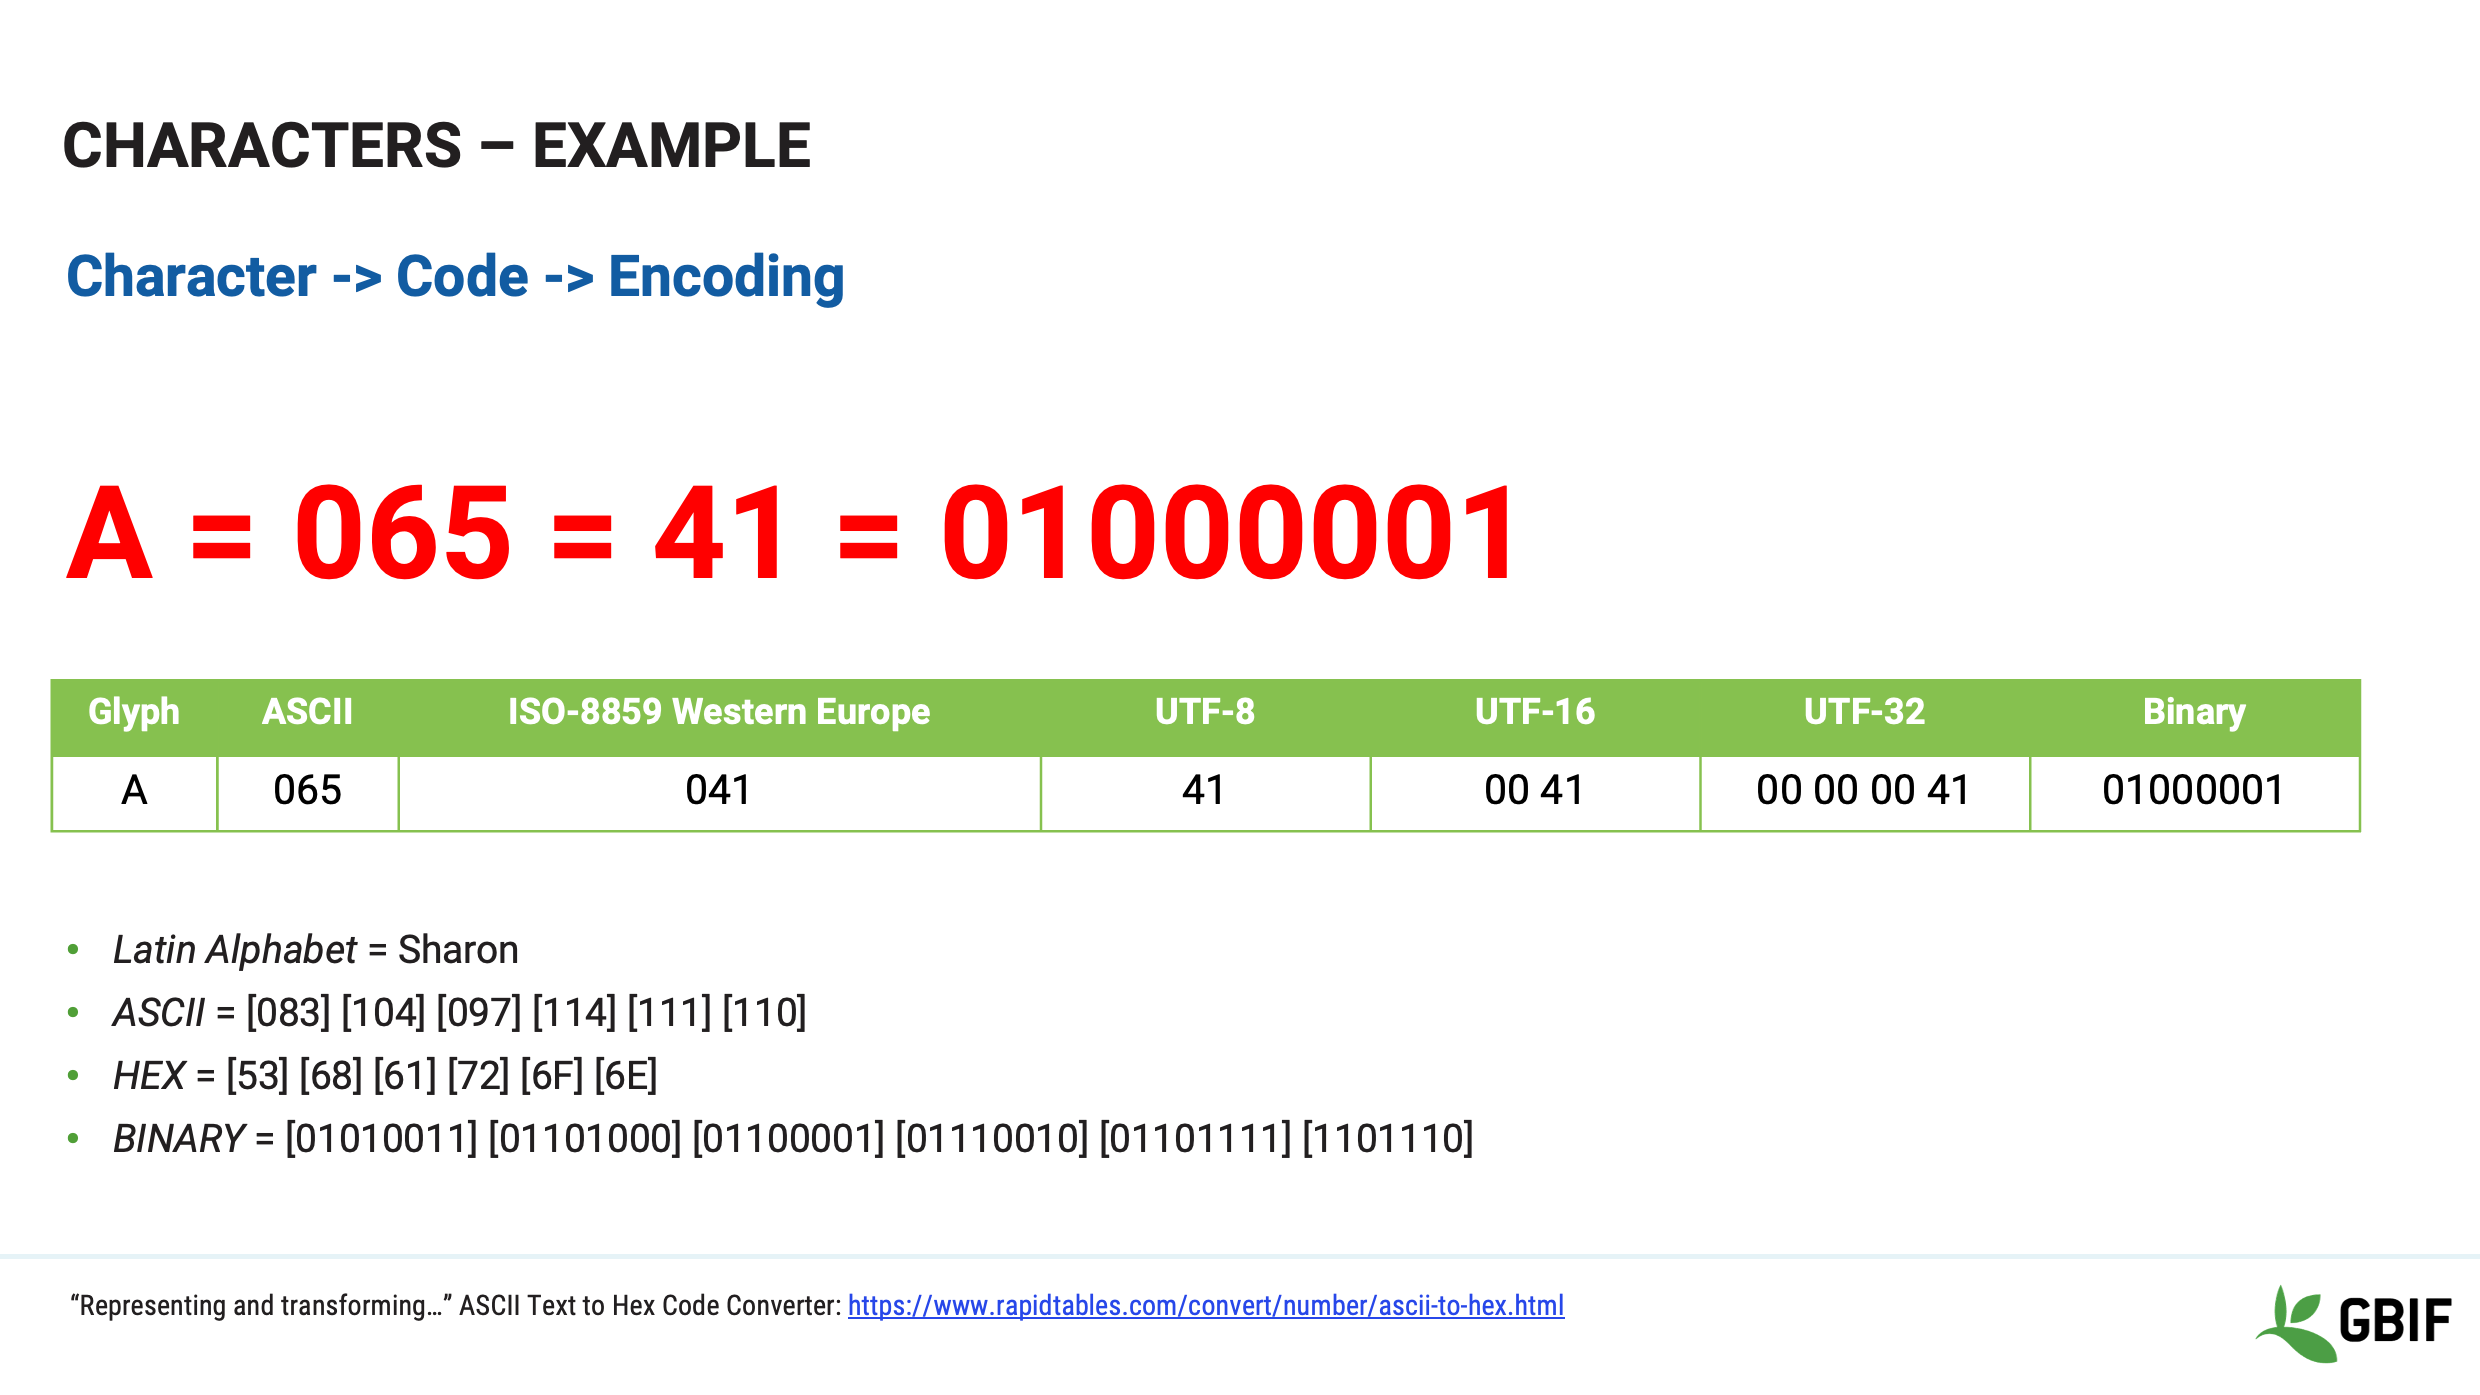
In this example we see how character encoding is used to map the capital letter A in the western alphabet.
The ASCII value for the capital letter A is the decimal number 65
which in HEXIDECIMAL is 041
and in BINARY 01000001
Try mapping your own name to Binary using the link at the bottom of the screen.
Slide 16 - Characters comparison
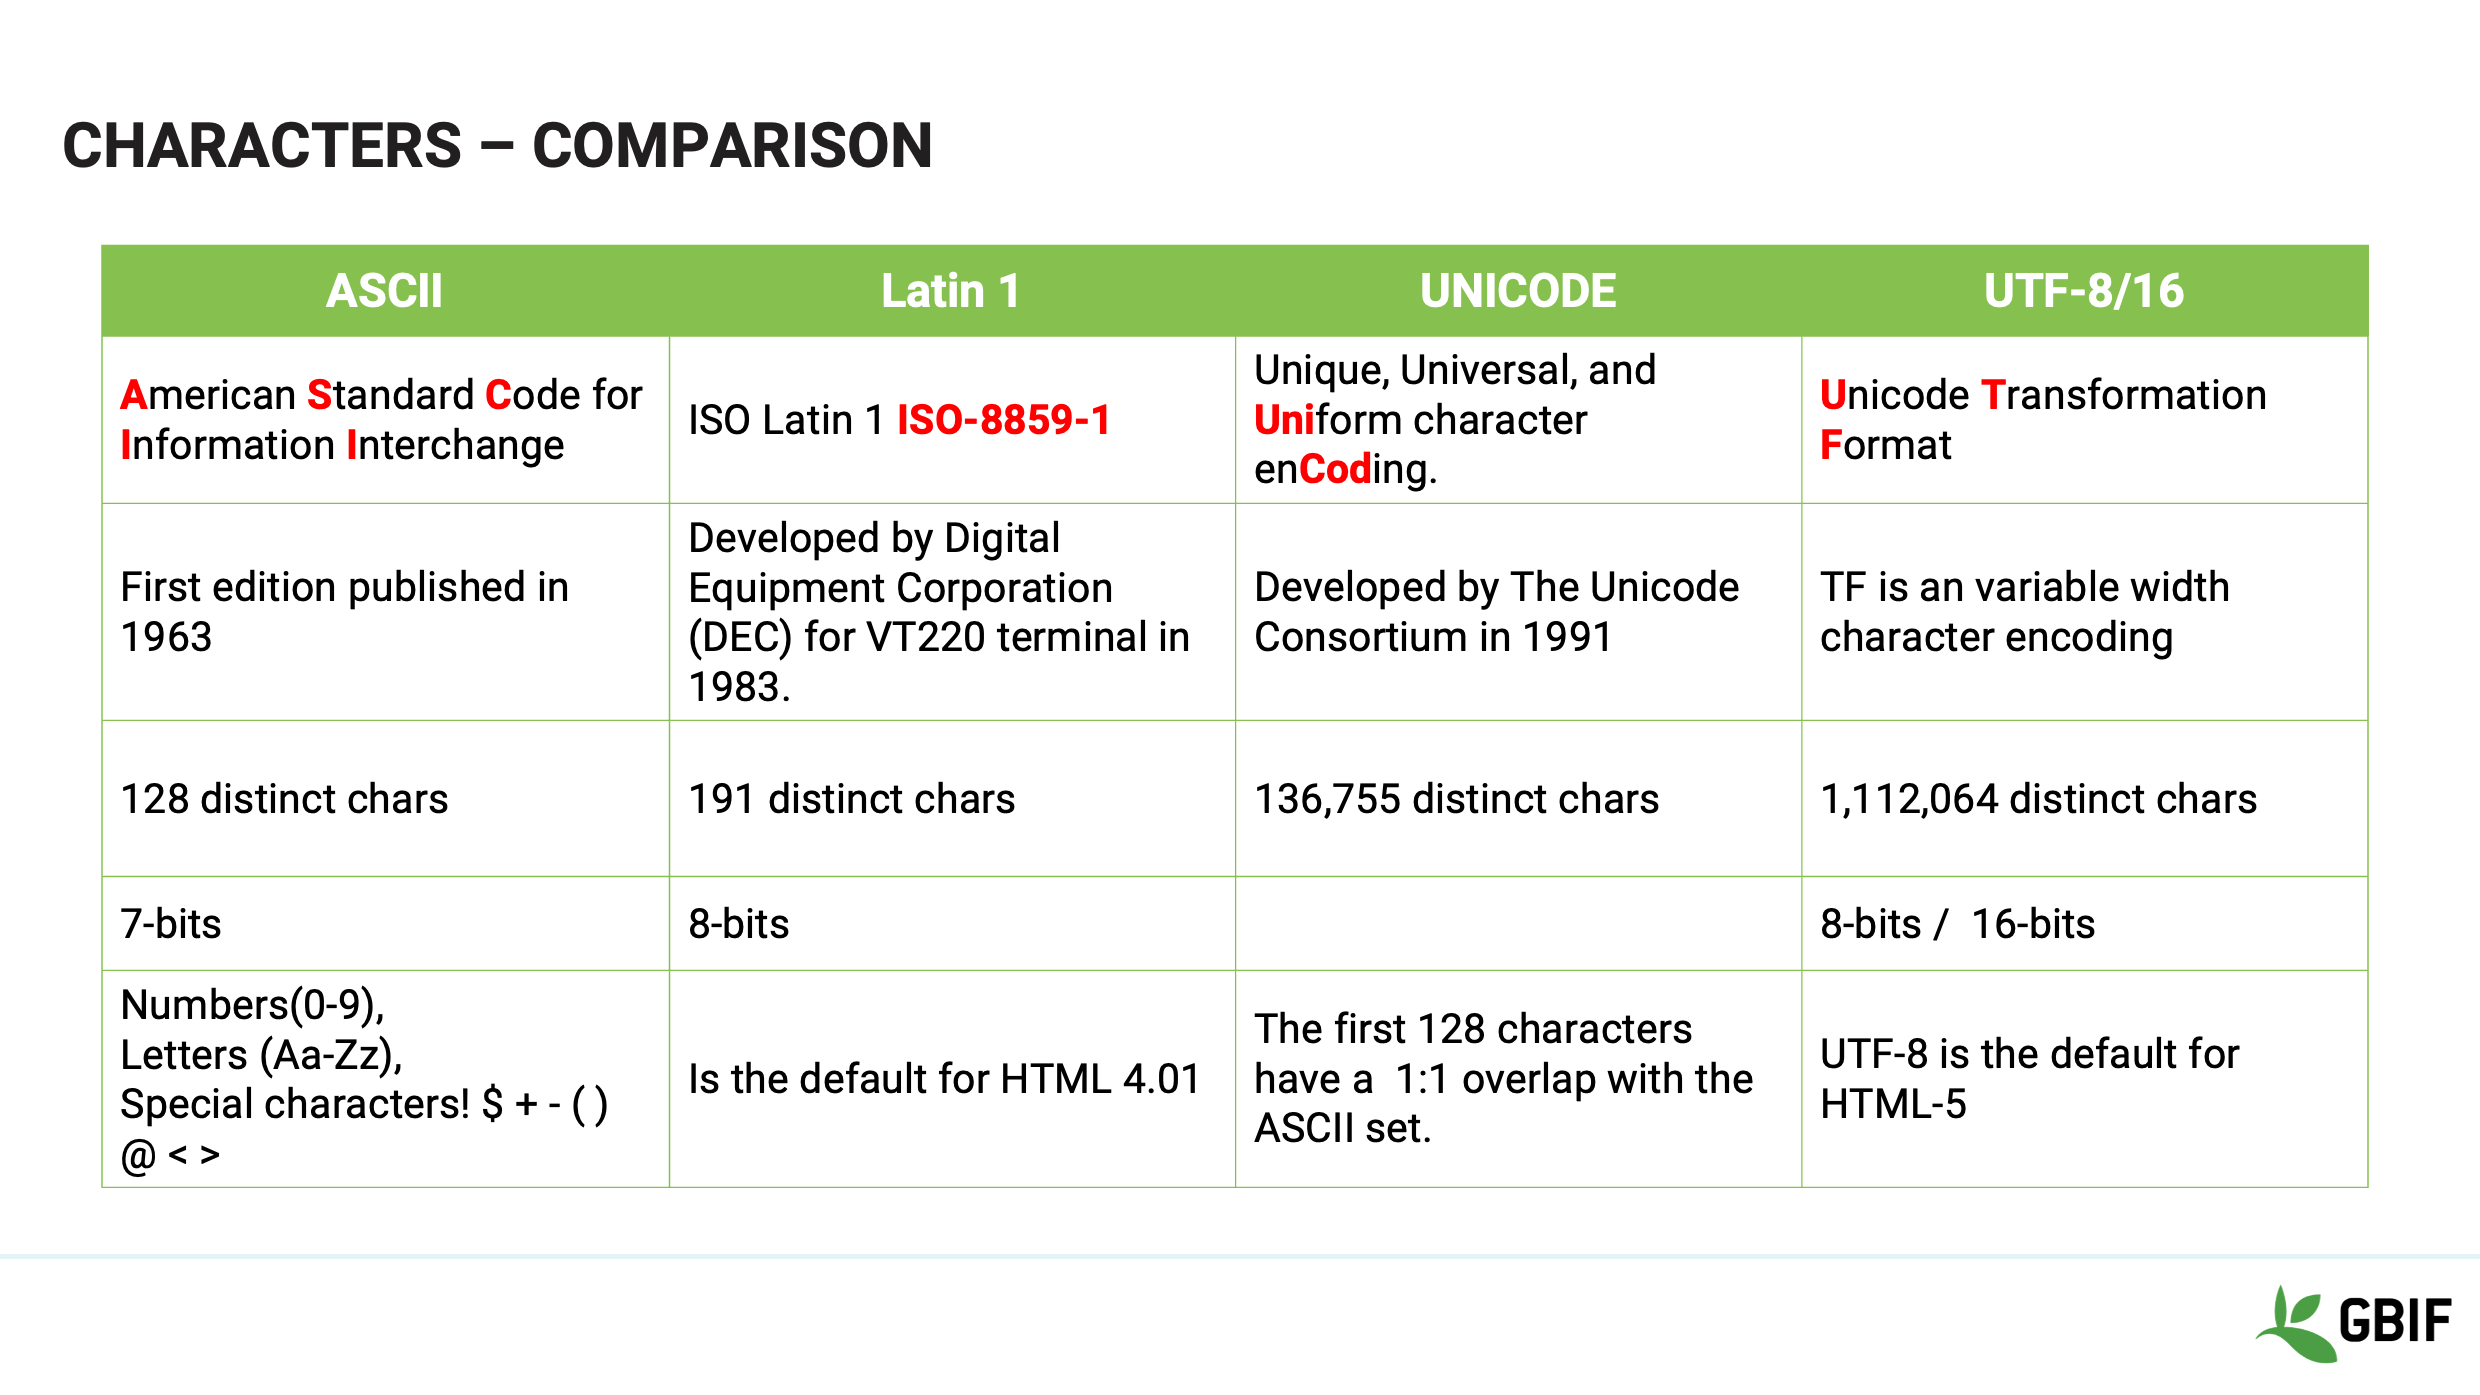
In effect what is happening is that when you type into a keyboard and save a file the software that you are using will select an encoding to save with it.
When you open that file again the software needs to know which encoding (map) to use to redisplay the information back to you correctly.
Slide 17 - Characters
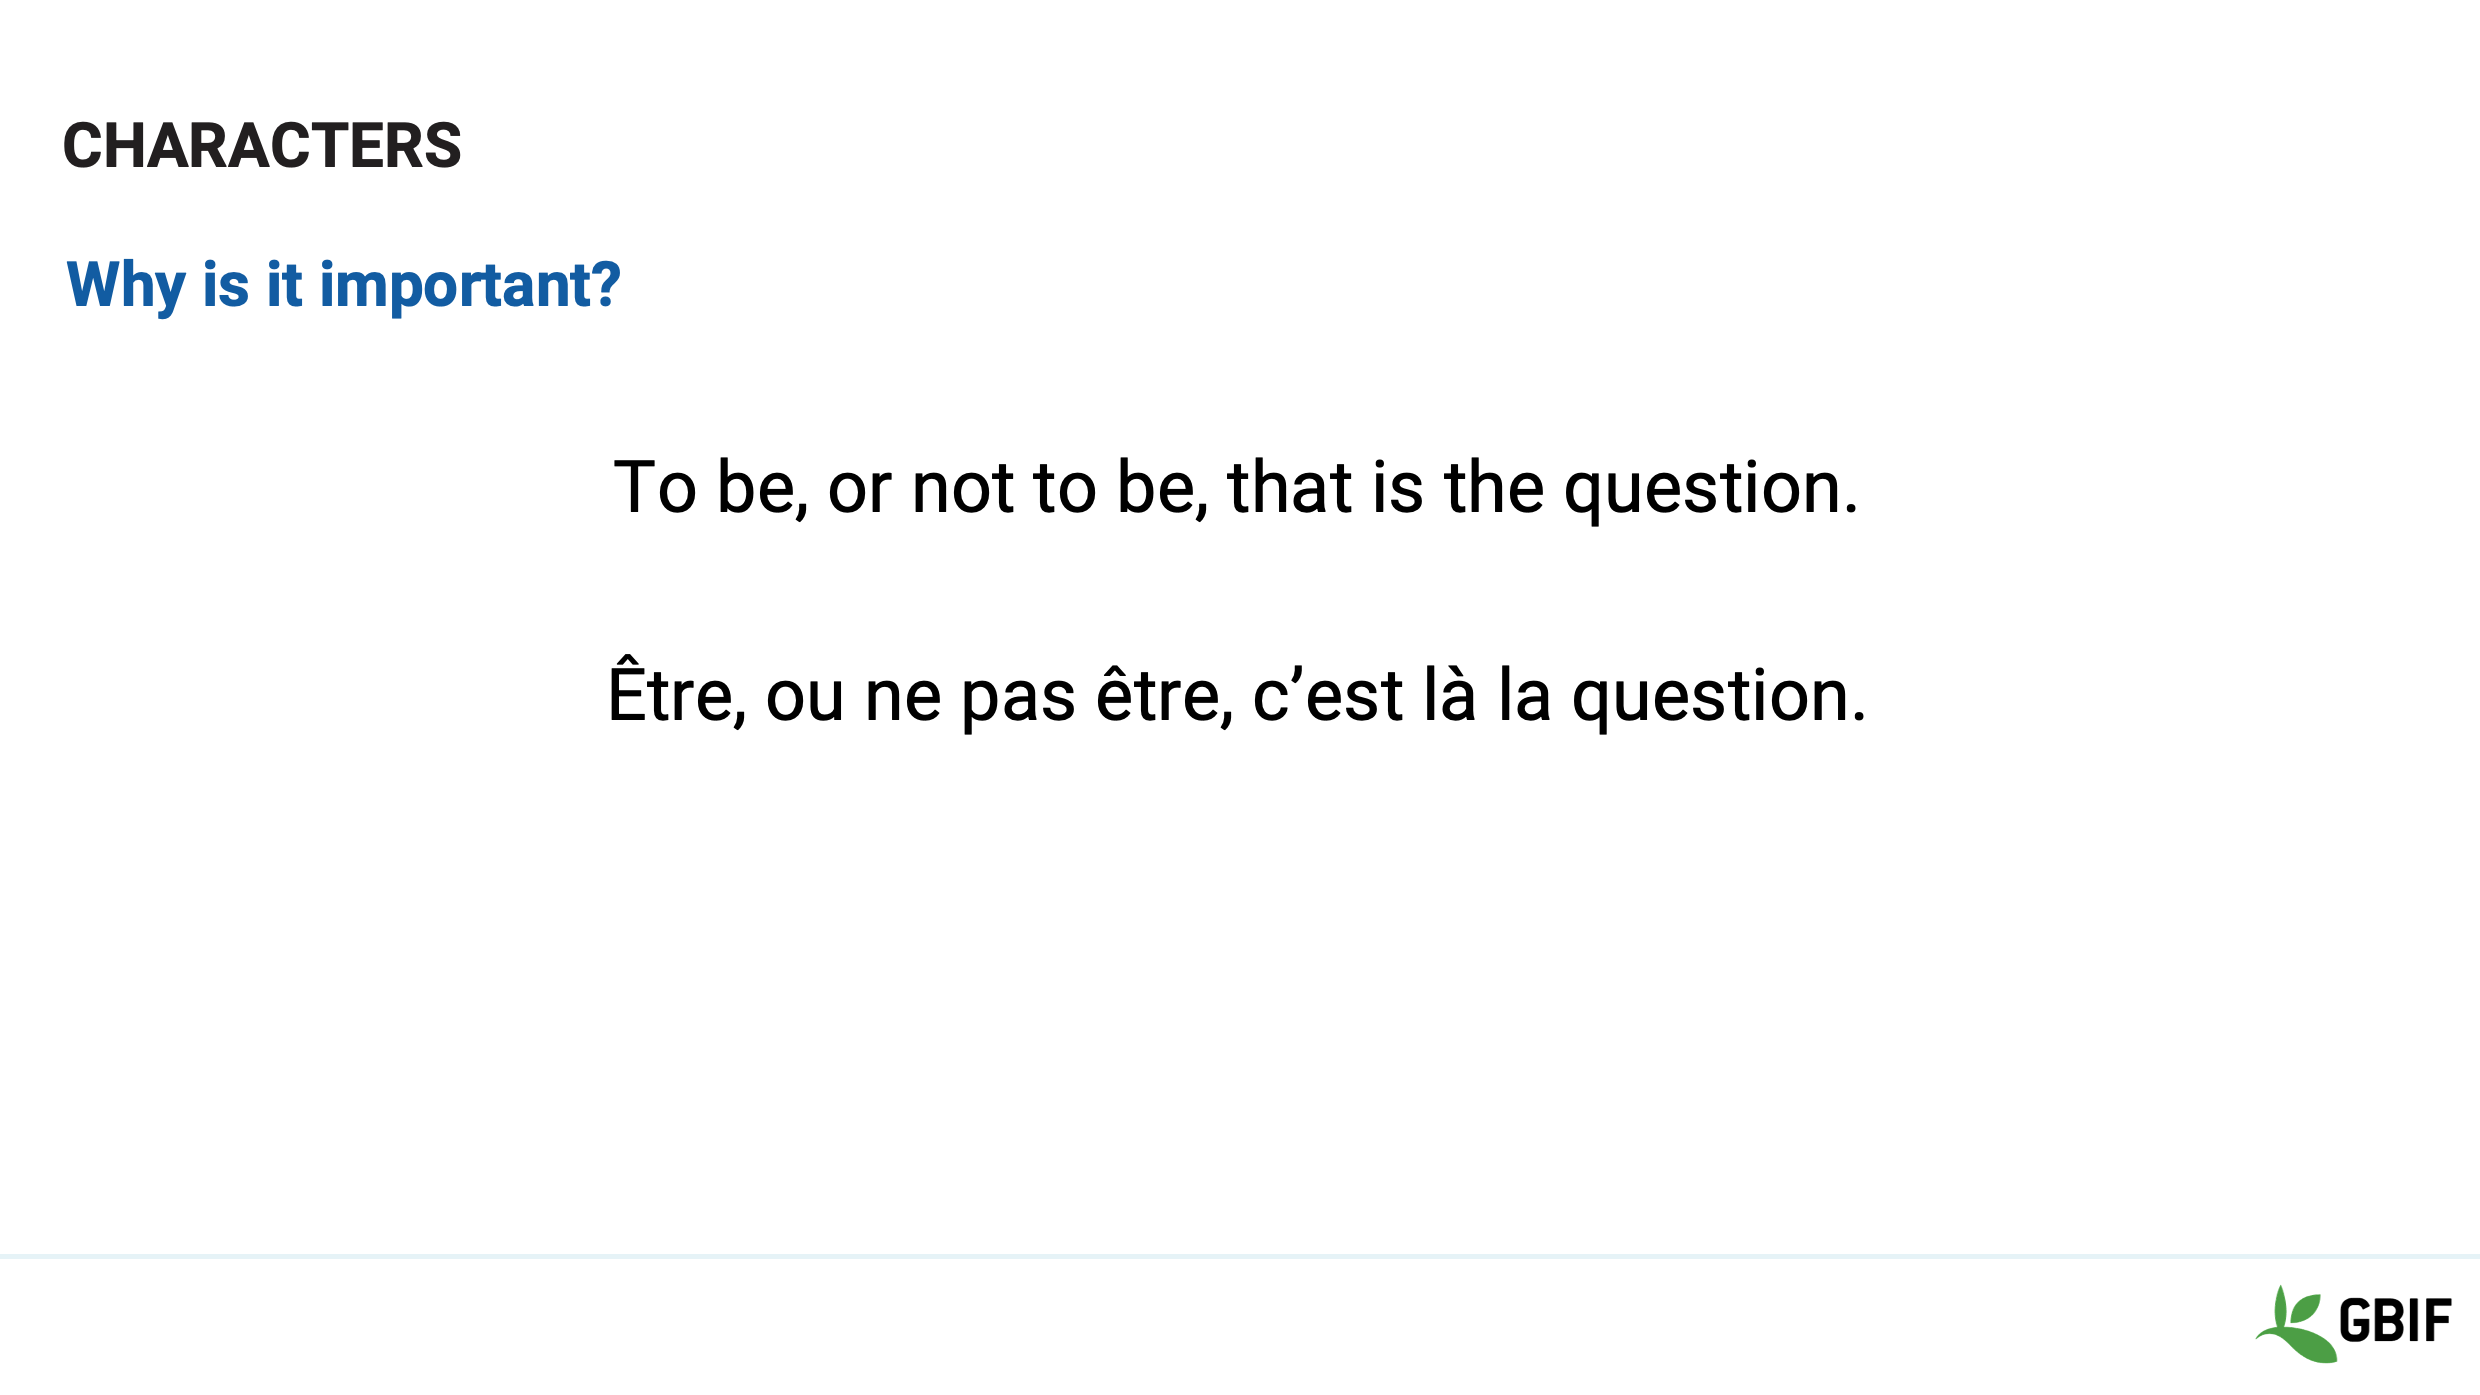
So why is this important to you as a data custodian?
Let’s say that you translate the start of Hamlet’s soliloquy
”To be or not to be, that is the question”
into French and then save the file with a text editor that uses the encoding Latin-1
Then you send it to a colleague to check the translation. Voila!
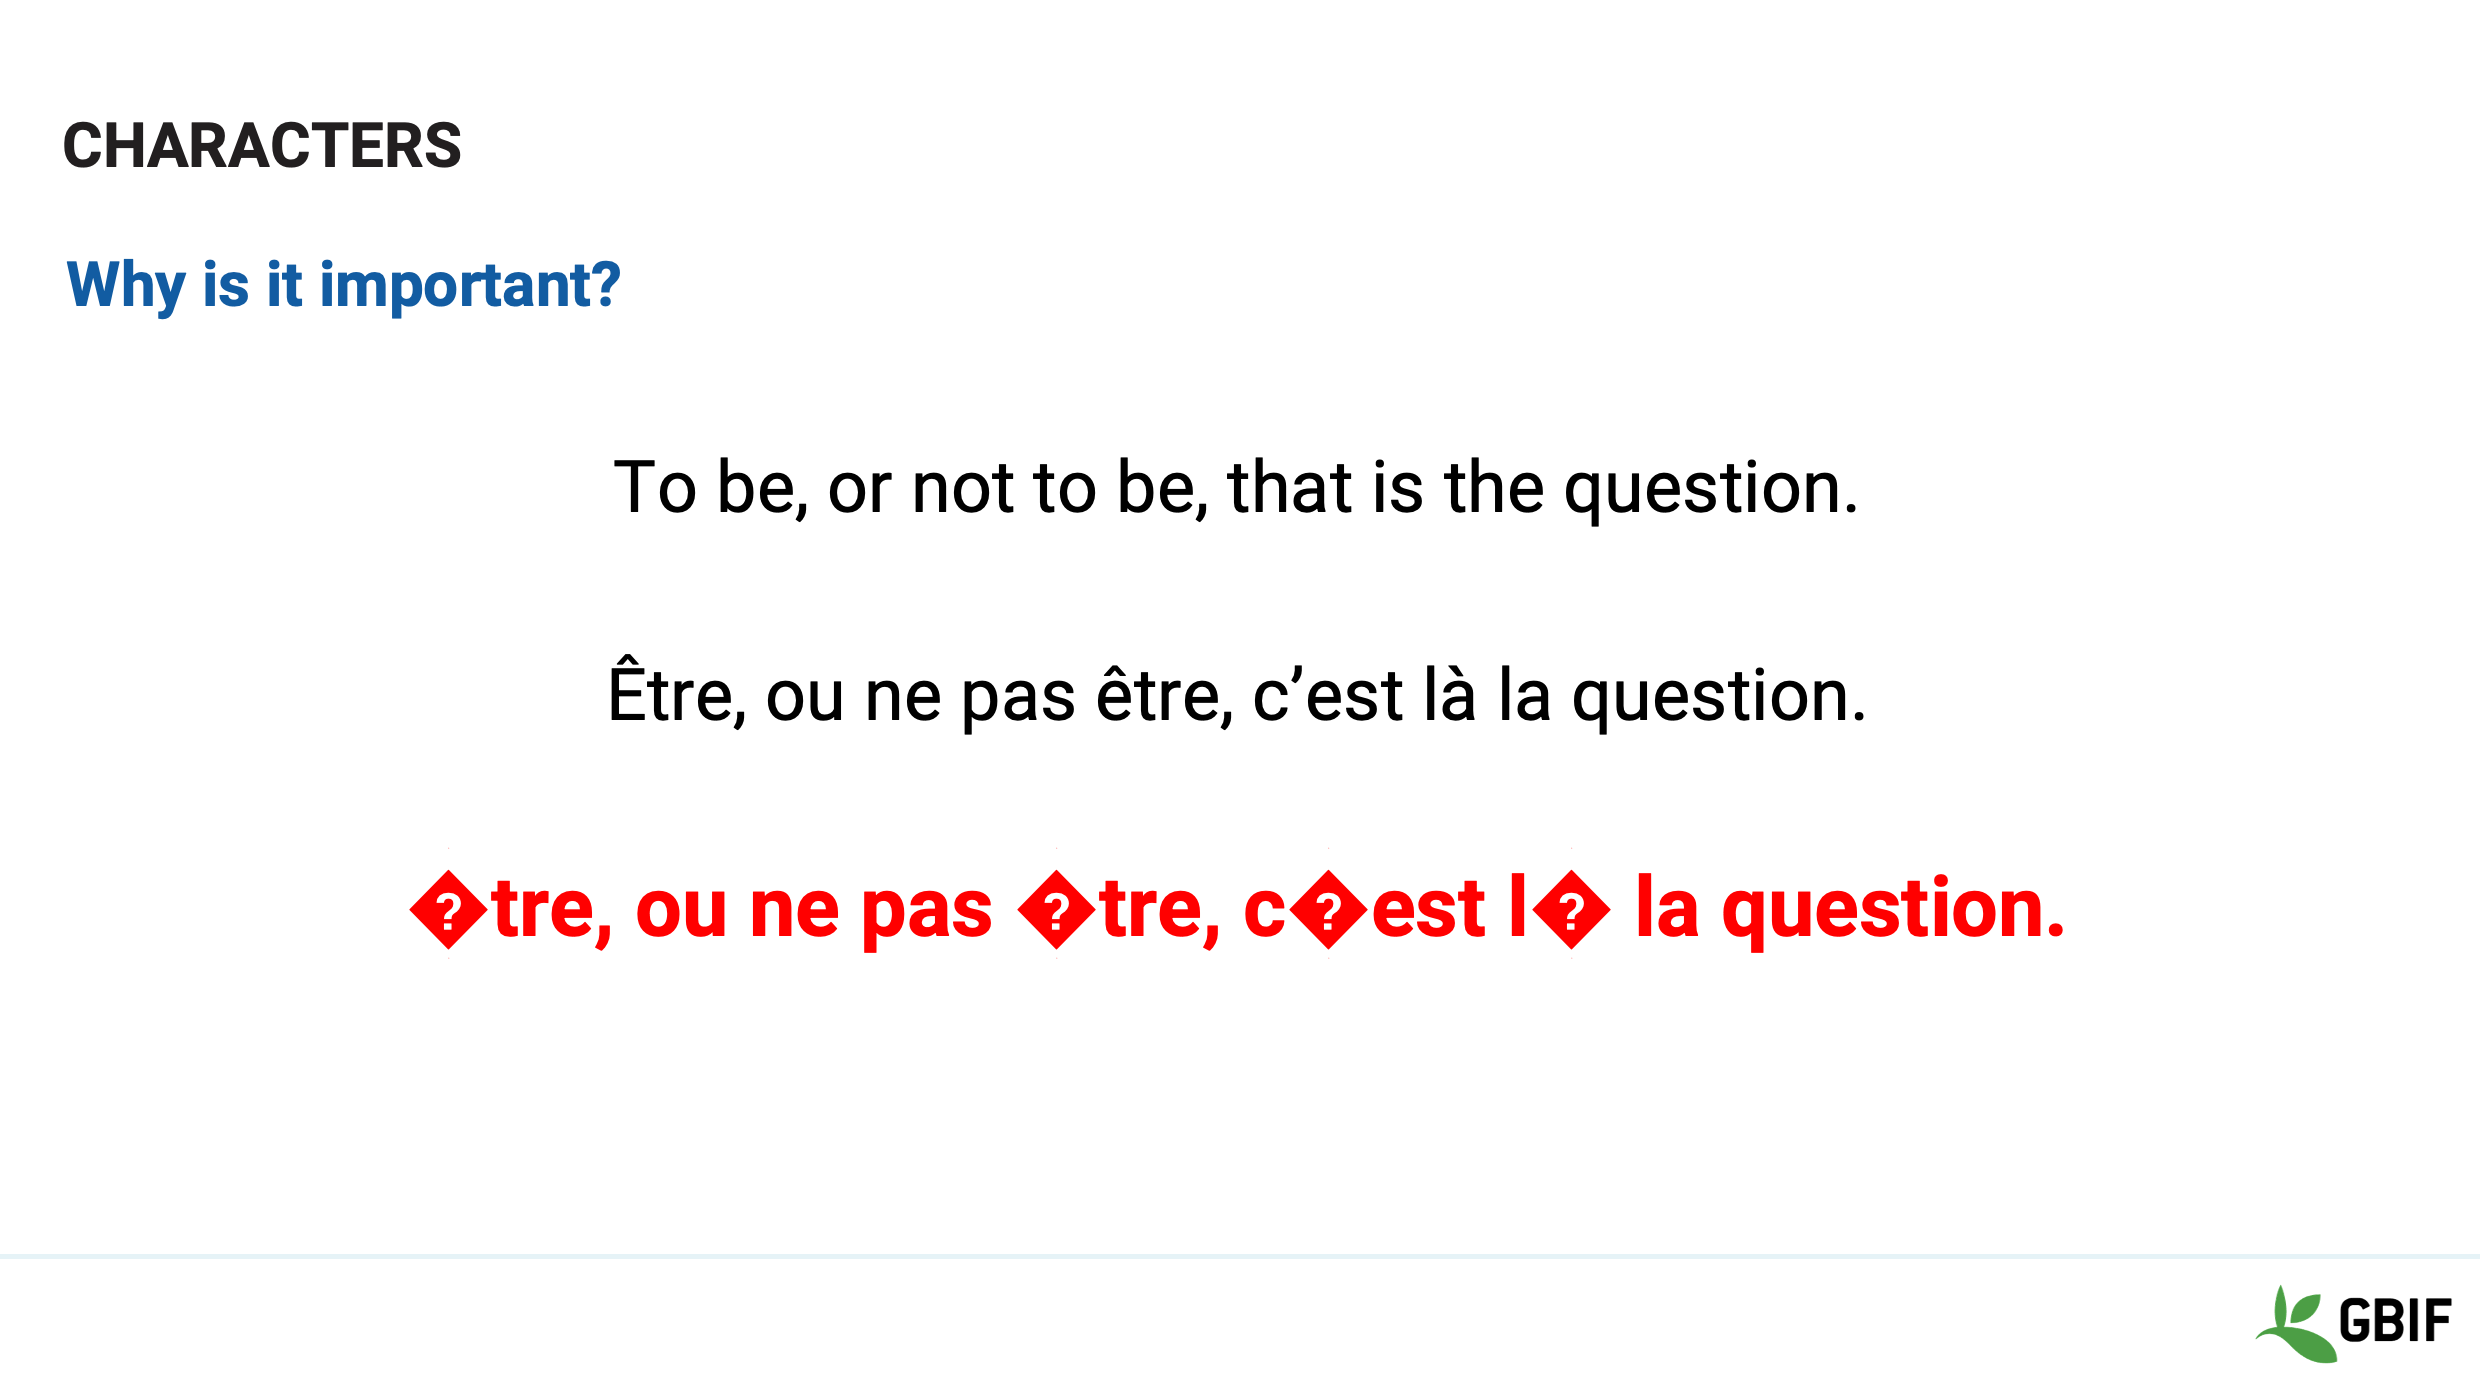
Slide 18 - Characters
When they open the file in MicroSoft Word this is what they see.
Mon dieu!
There are some unexpected characters.
You forgot to tell your colleague that you where using Latin-1 as the encoding.
MicroSoft Word on their end was set to use the encoding set Unicode UTF-8. The maps did not match.
Depending on the software the data may be irretrievably corrupted.
Slide 19 - Review
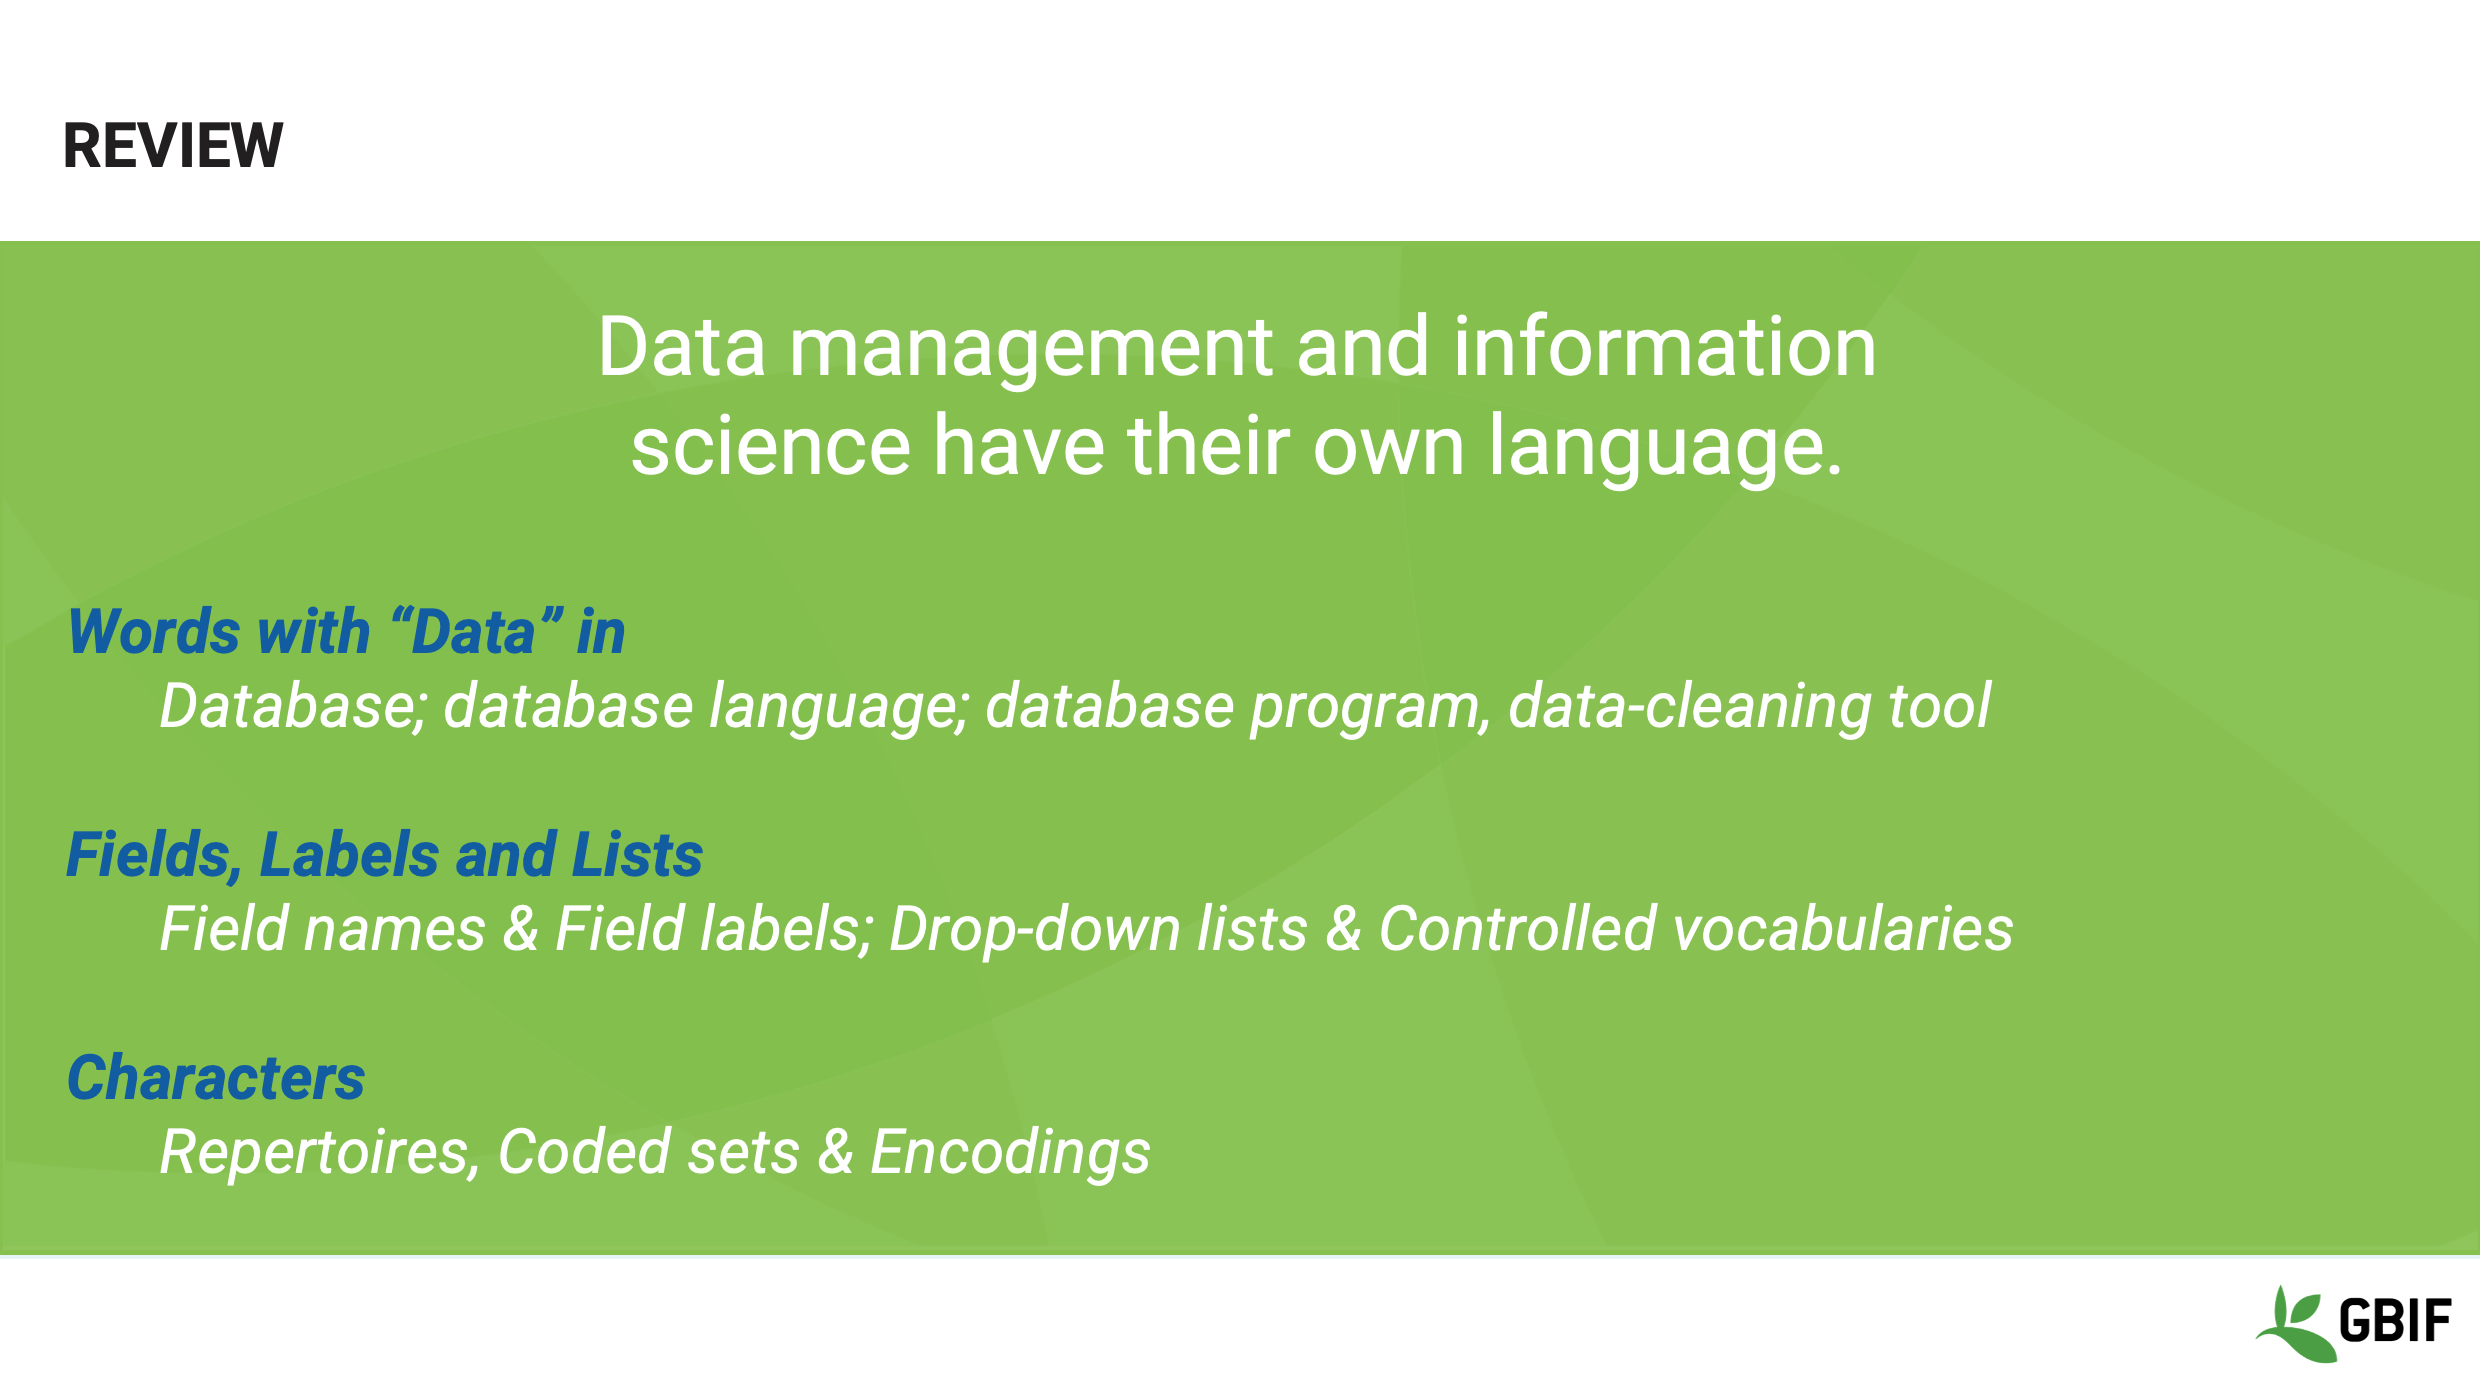
In review we have looked at the differences between the phrases:
-
Database; database language; database program, data-cleaning tool
-
Field names & Field labels; Drop-down lists & Controlled vocabularies and between
-
Repertoires, Coded sets & Encodings
And shown that although the terms may seem similar the in fact have very different definitions.

Slide 20 - Wrap-up
Remember that:
“…The first step in wisdom is to know the things themselves; this notion consists in having a true idea of the objects.”
We often take for granted that there is a whole language associated with biodiversity informatics that is not commonplace and has to be learned. There is no shame in going back to basics and getting to grips with the vocabulary, grammar and syntax just like with any new language.

Slide 21 - Conclusion
This video is part of a series of presentations used in the GBIF Biodiversity Data Mobilization course. The biodiversity data mobilization curriculum was originally developed as part of the Biodiversity Information Development Programme funded by the European Union.
This presentation was originally created and narrated by Sharon Grant with additional contributions by BID and BIFA Trainers, Mentors and Students.
Software
|
In this video (05:58), you will review examples of the different types of applications and software available in the world of biodiversity mobilization informatics. If you are unable to watch the embedded video, you can download it locally. (MP4 - 23.5 MB) |
Presentation transcript
Click to expand

Slide 1 - Foundations - Software terminology
This session is foundation work and part of the Terminology section We will be introducing you to types of software used in data mobilization.
Image by Carsten Witzel, obtained via http://www.freeimages.com/photo/root-of-a-tree-1371557.
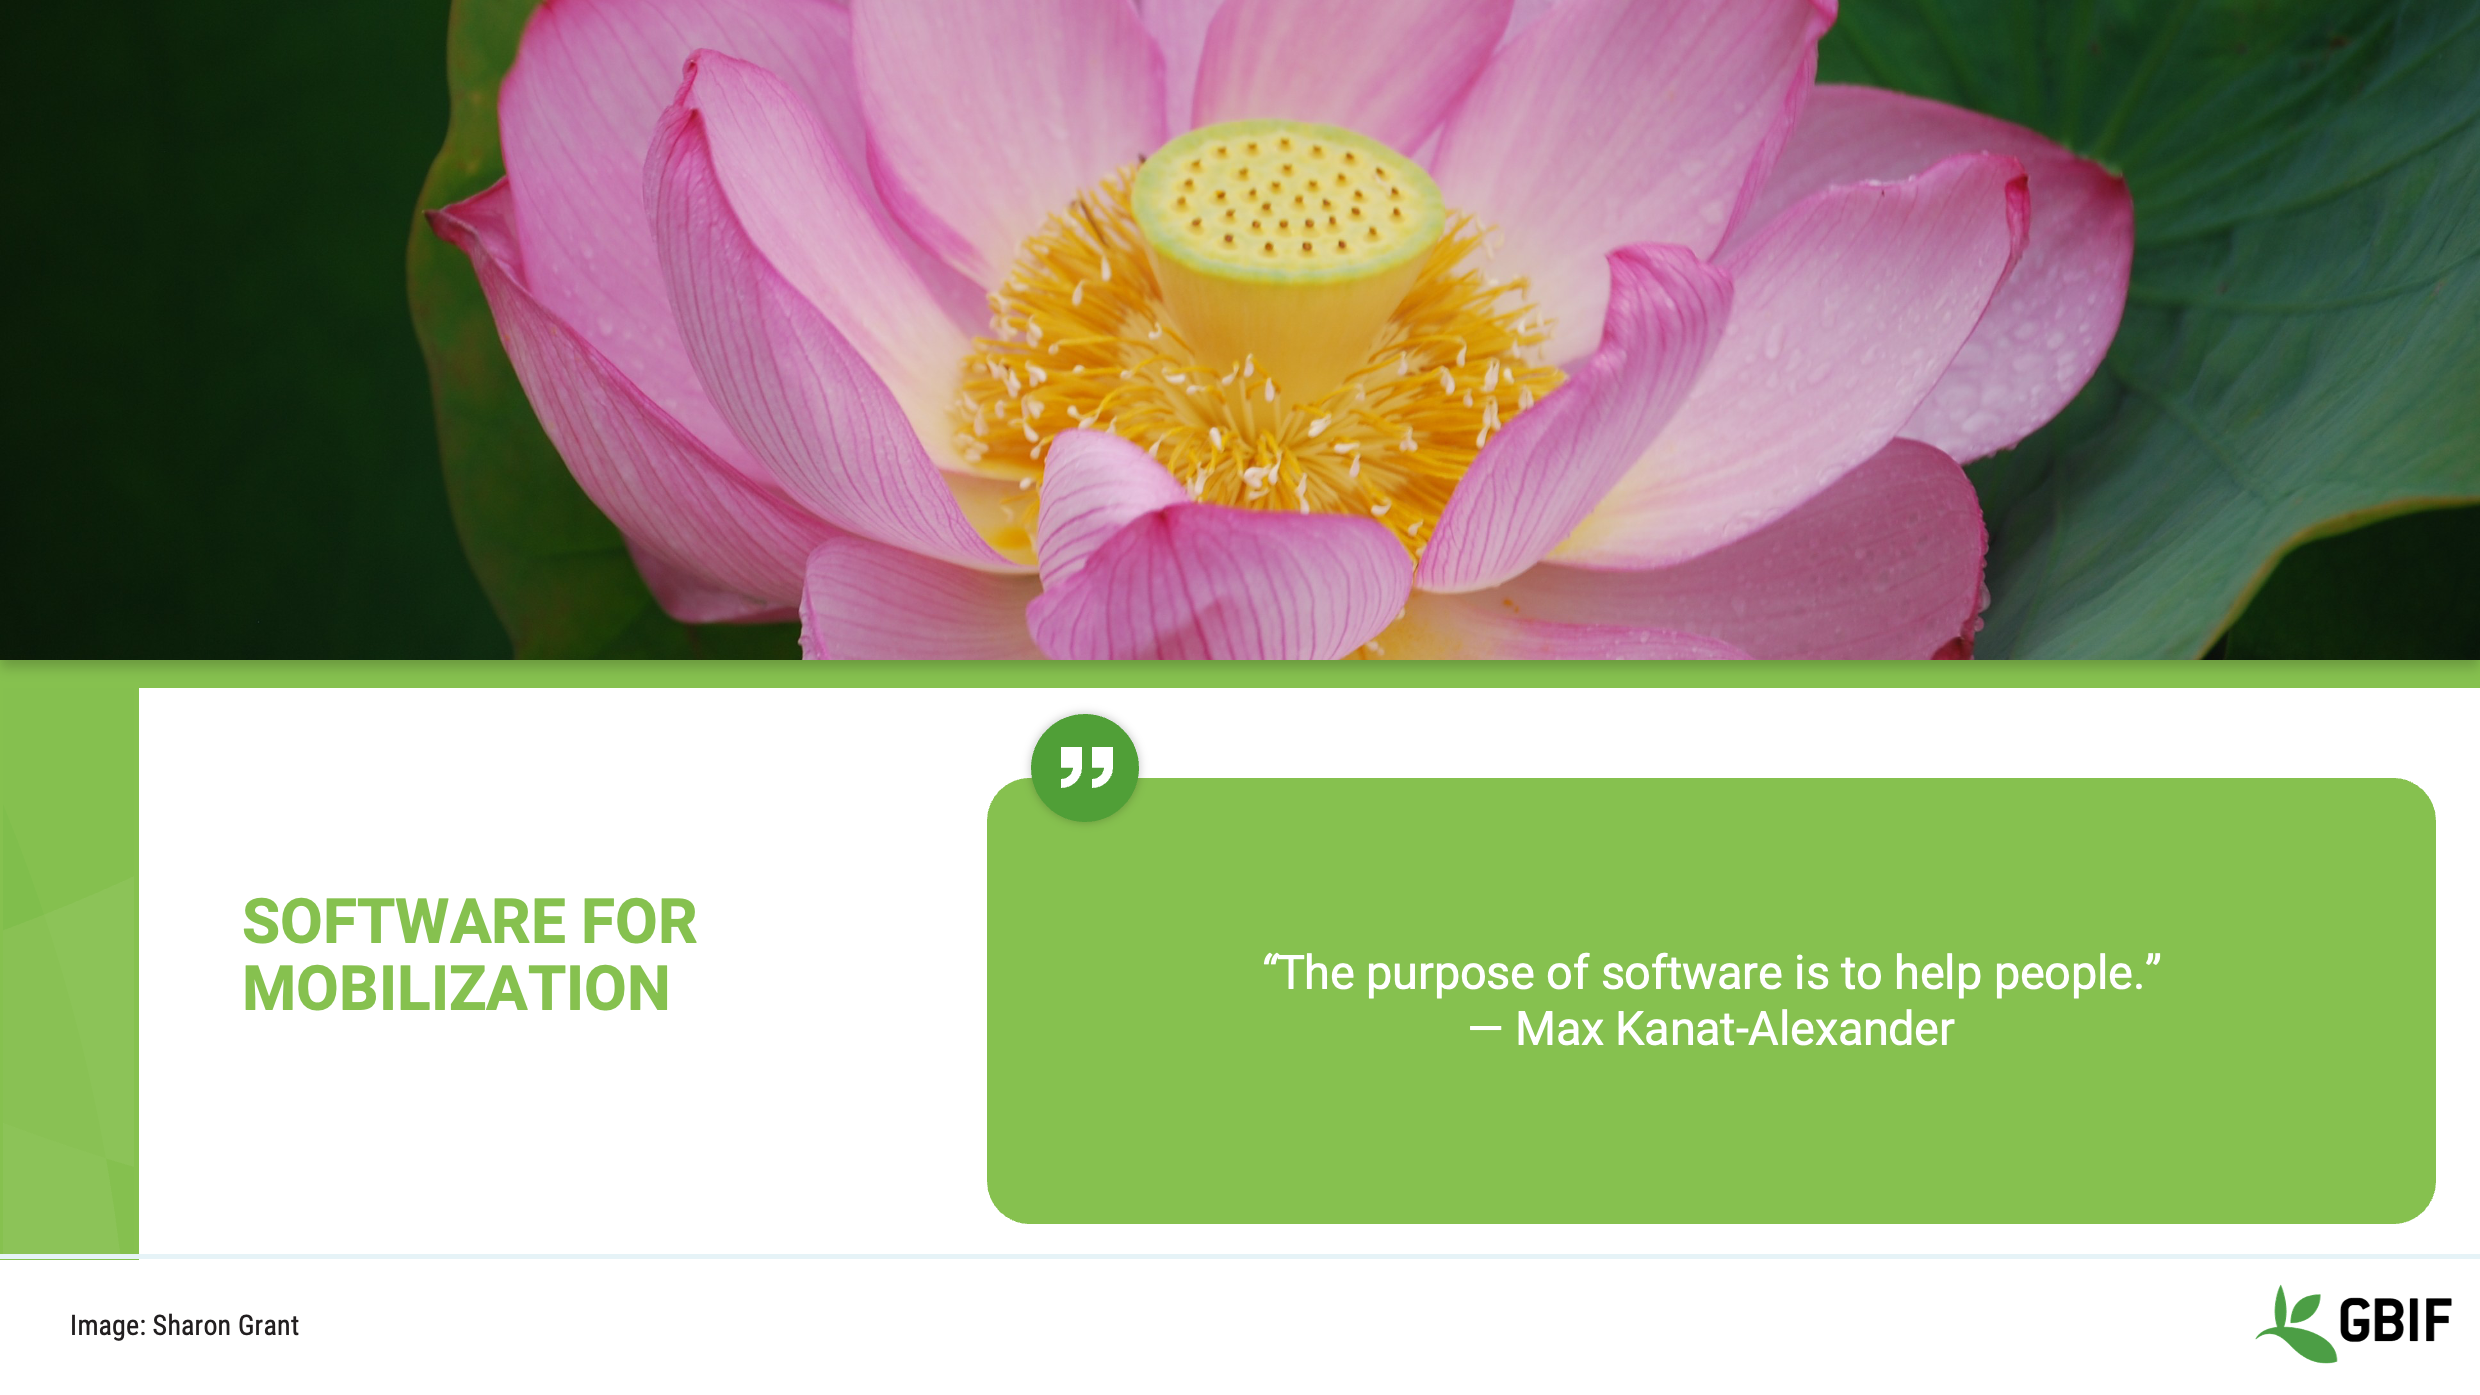
Slide 2 - Software for mobilization
The purpose of this short presentation is to give you some examples of the different types of applications and software available in the world of biodiversity mobilization informatics.
Hopefully it will help you to start to think about what uses they may be put too and what types of things might be practical for you.
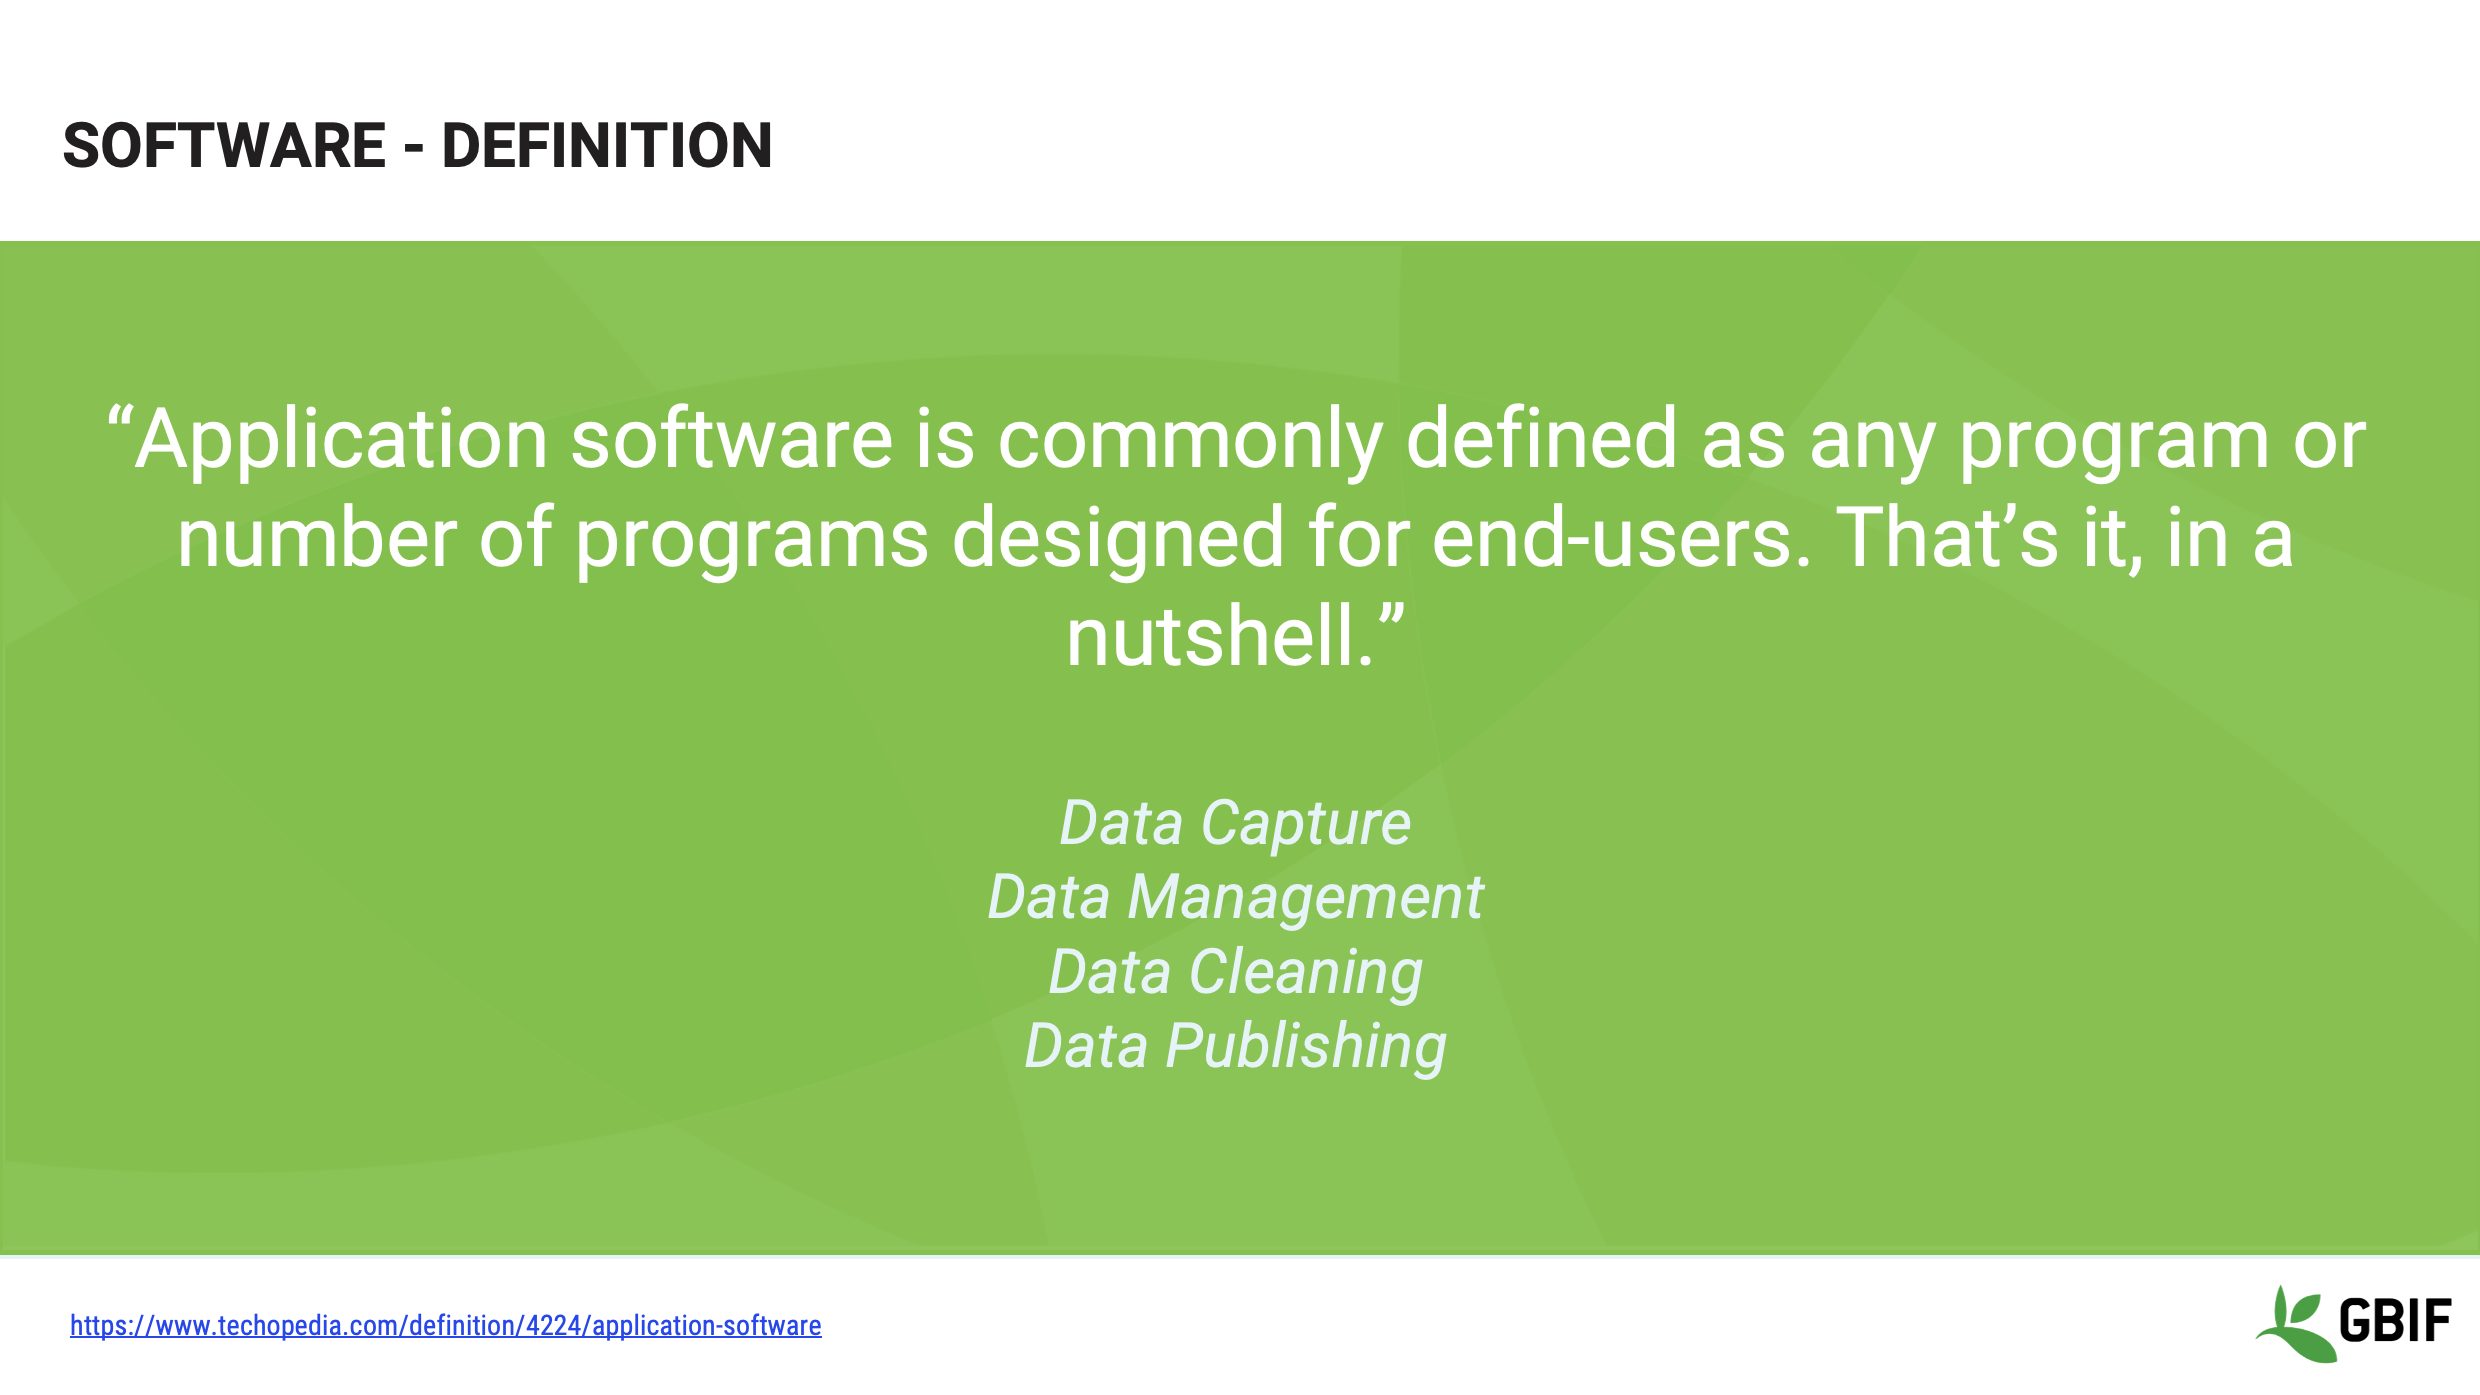
Slide 3 - Software definition
So very briefly, a definition.
We are making a distinction here between all software and those applications which have been created for an end-user to carry out a task.
We will take a look at software that can be used for:
-
Data Capture
-
Data Management
-
Data Cleaning and
-
Data Publishing
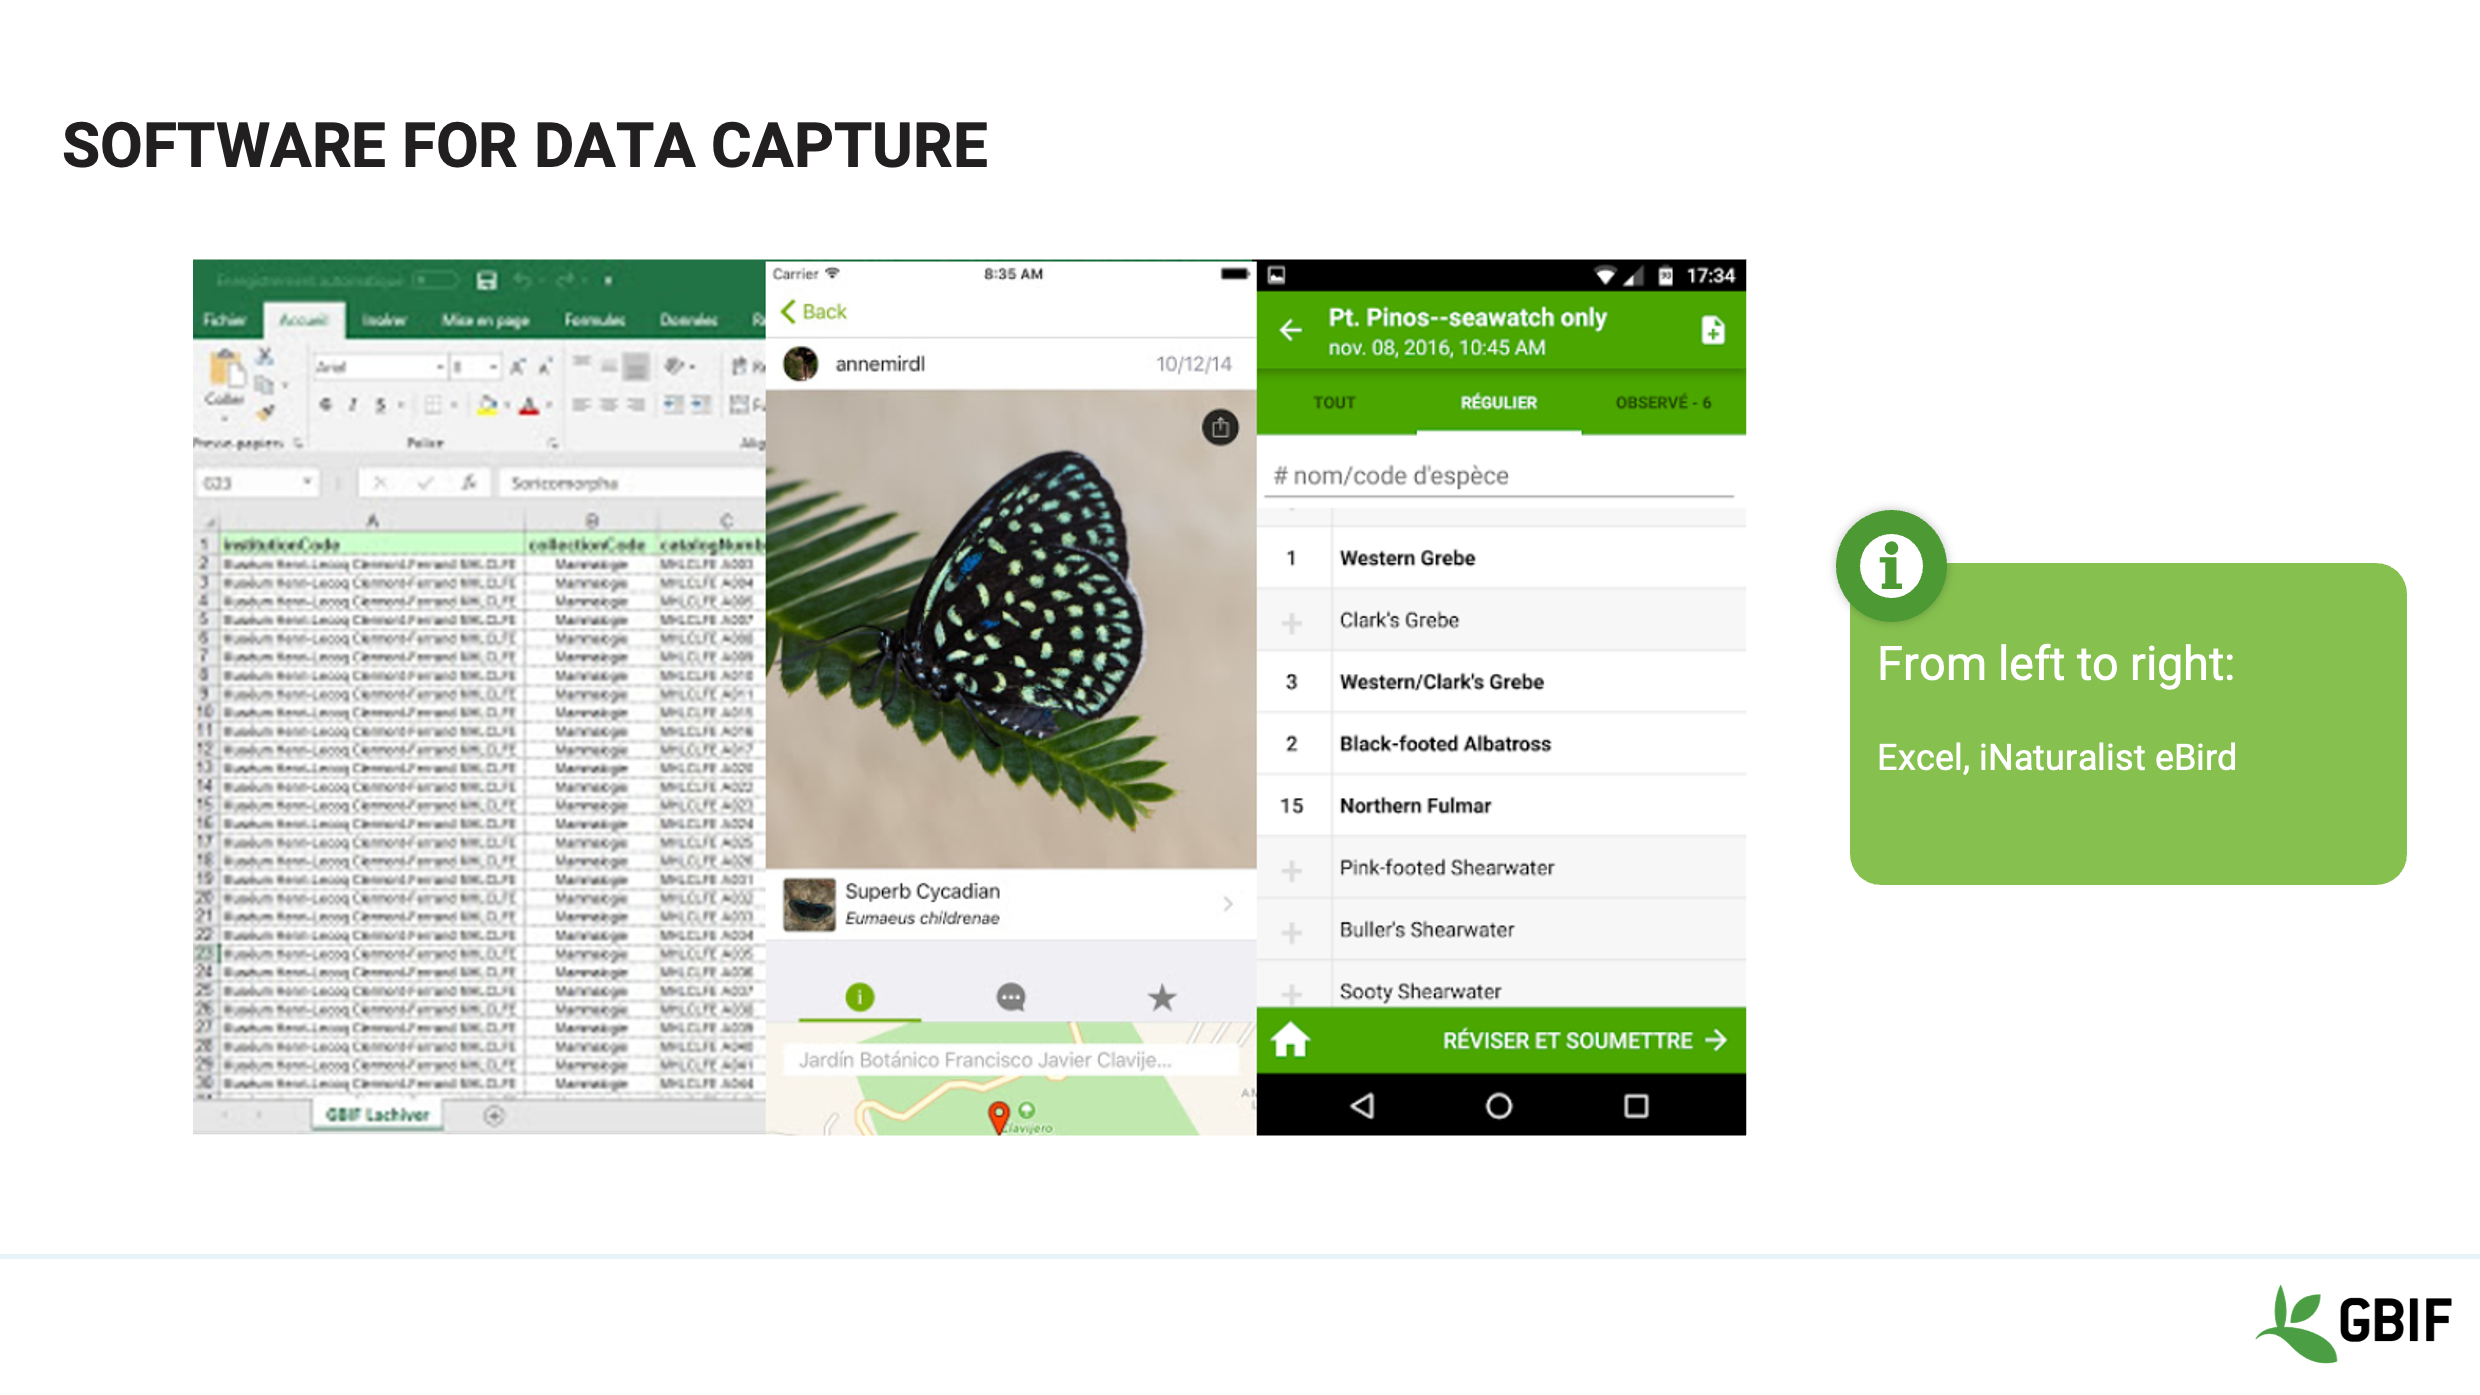
Slide 4 - Software for data capture
In the realm of data capture software, there is often no need to go “big” when capturing information initially, especially in the field.
You can capture information from collection specimens or live observations in a simple spreadsheet such as:
Excel, OpenOffice, LibreOffice or Google Sheets.
There may even not be a need to create your own system at all. Apps such as iNaturalist, or eBird are stable, robust and have simple intuitive interfaces.
Whichever the choice, it is important to think about the long term preservation of the data that you collect.
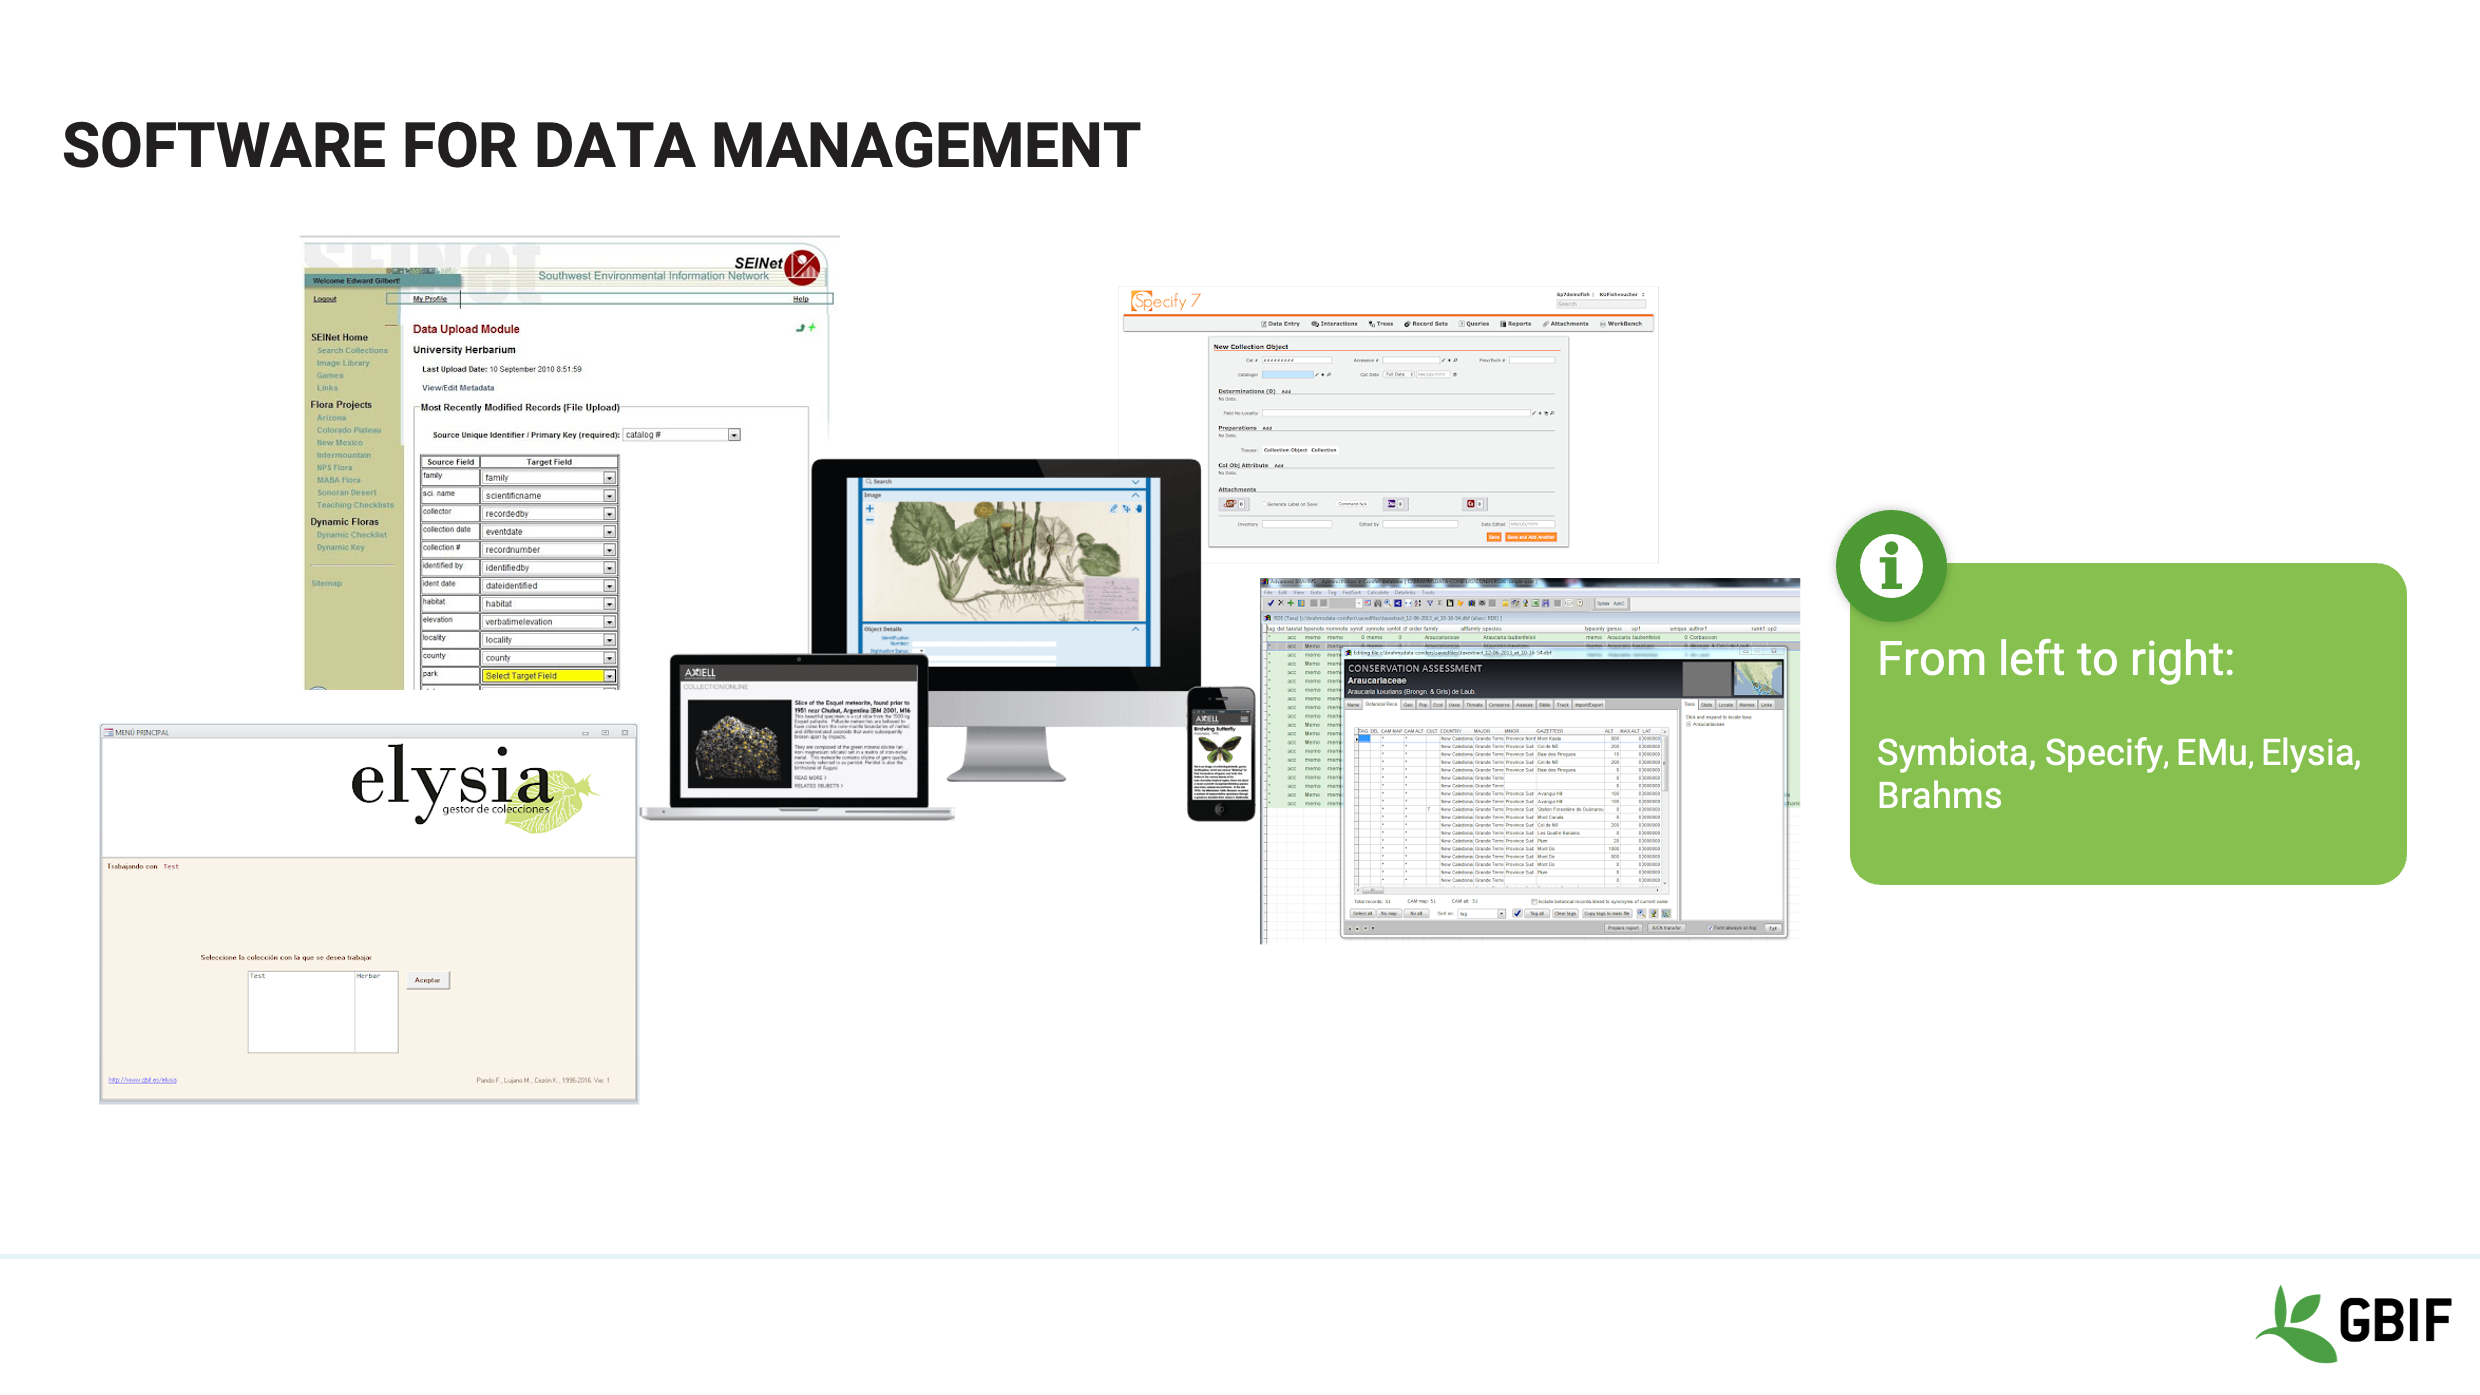
Slide 5 - Software for data management
So, depending on your needs, a more complex data management software might be the right solution for your data. Especially if long term retention and preservation is a priority.
More stable management platforms also better support sharing of data to multiple audiences.
There are many choices which vary in terms of cost and support and a few are shown here. From left to right:
Symbiota, Specify, EMu, Elysia and Brahms.
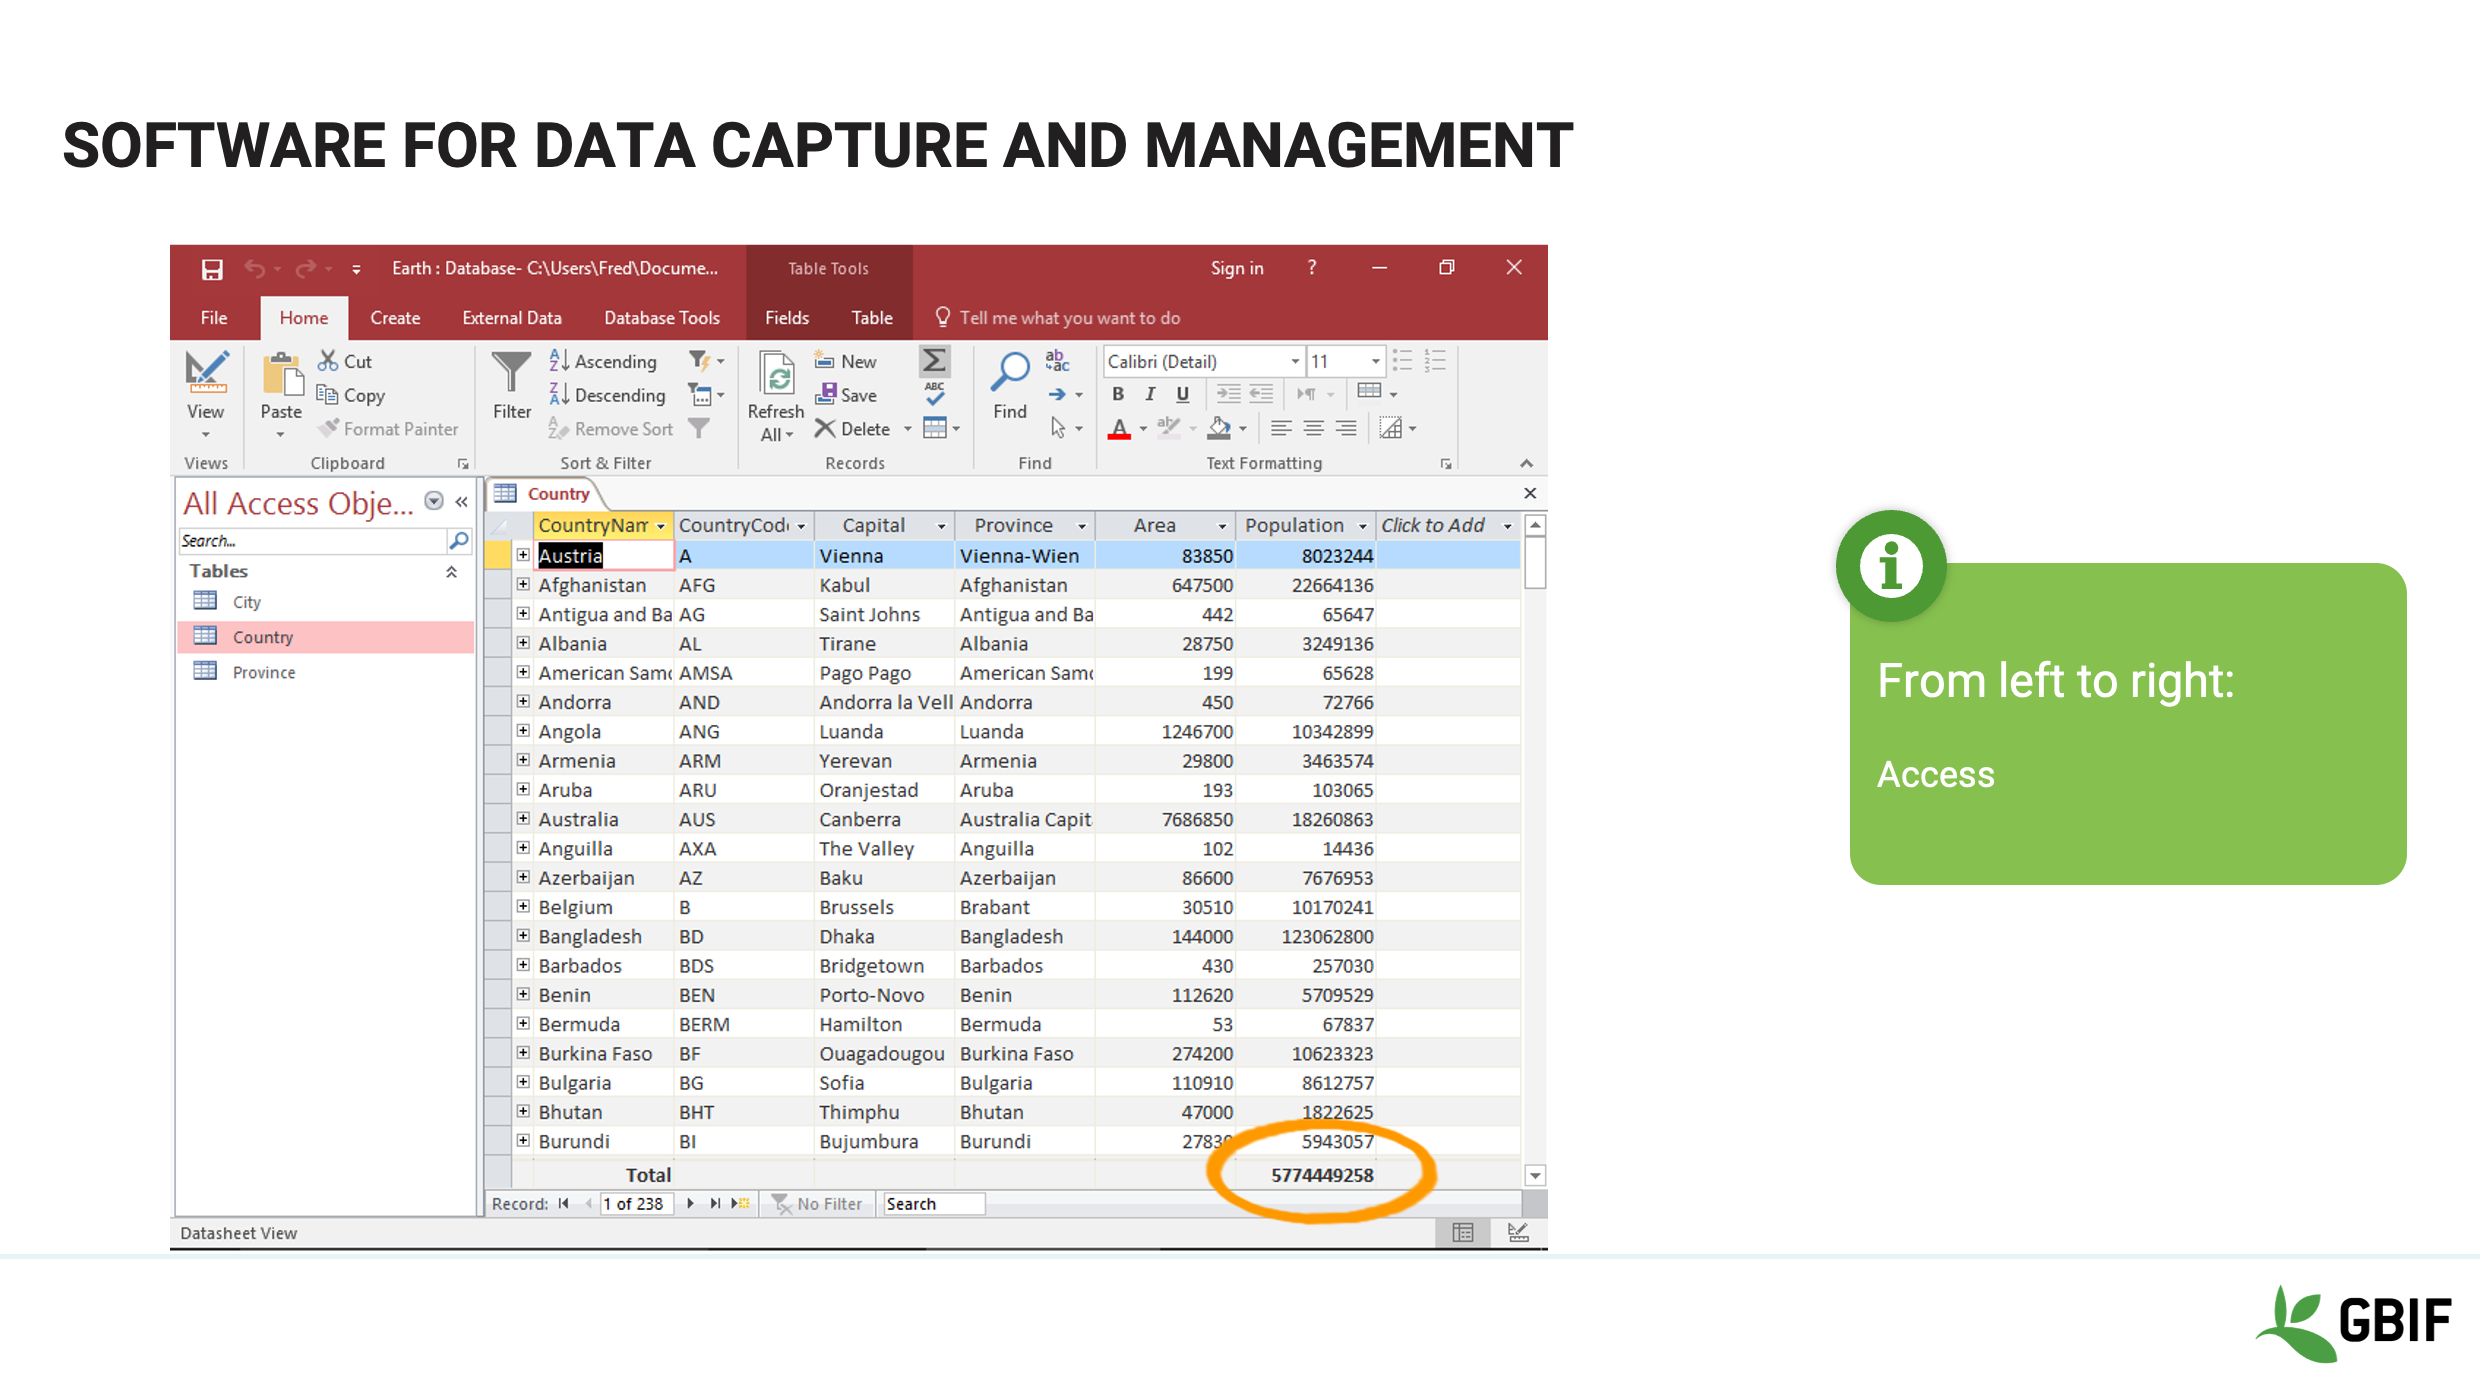
Slide 6 - Software for data capture and management
If a home-grown solution is preferred and can be supported, relational database software can provide cheaper alternatives.
Examples incluse MySQL, SQLServer, Access or filemaker
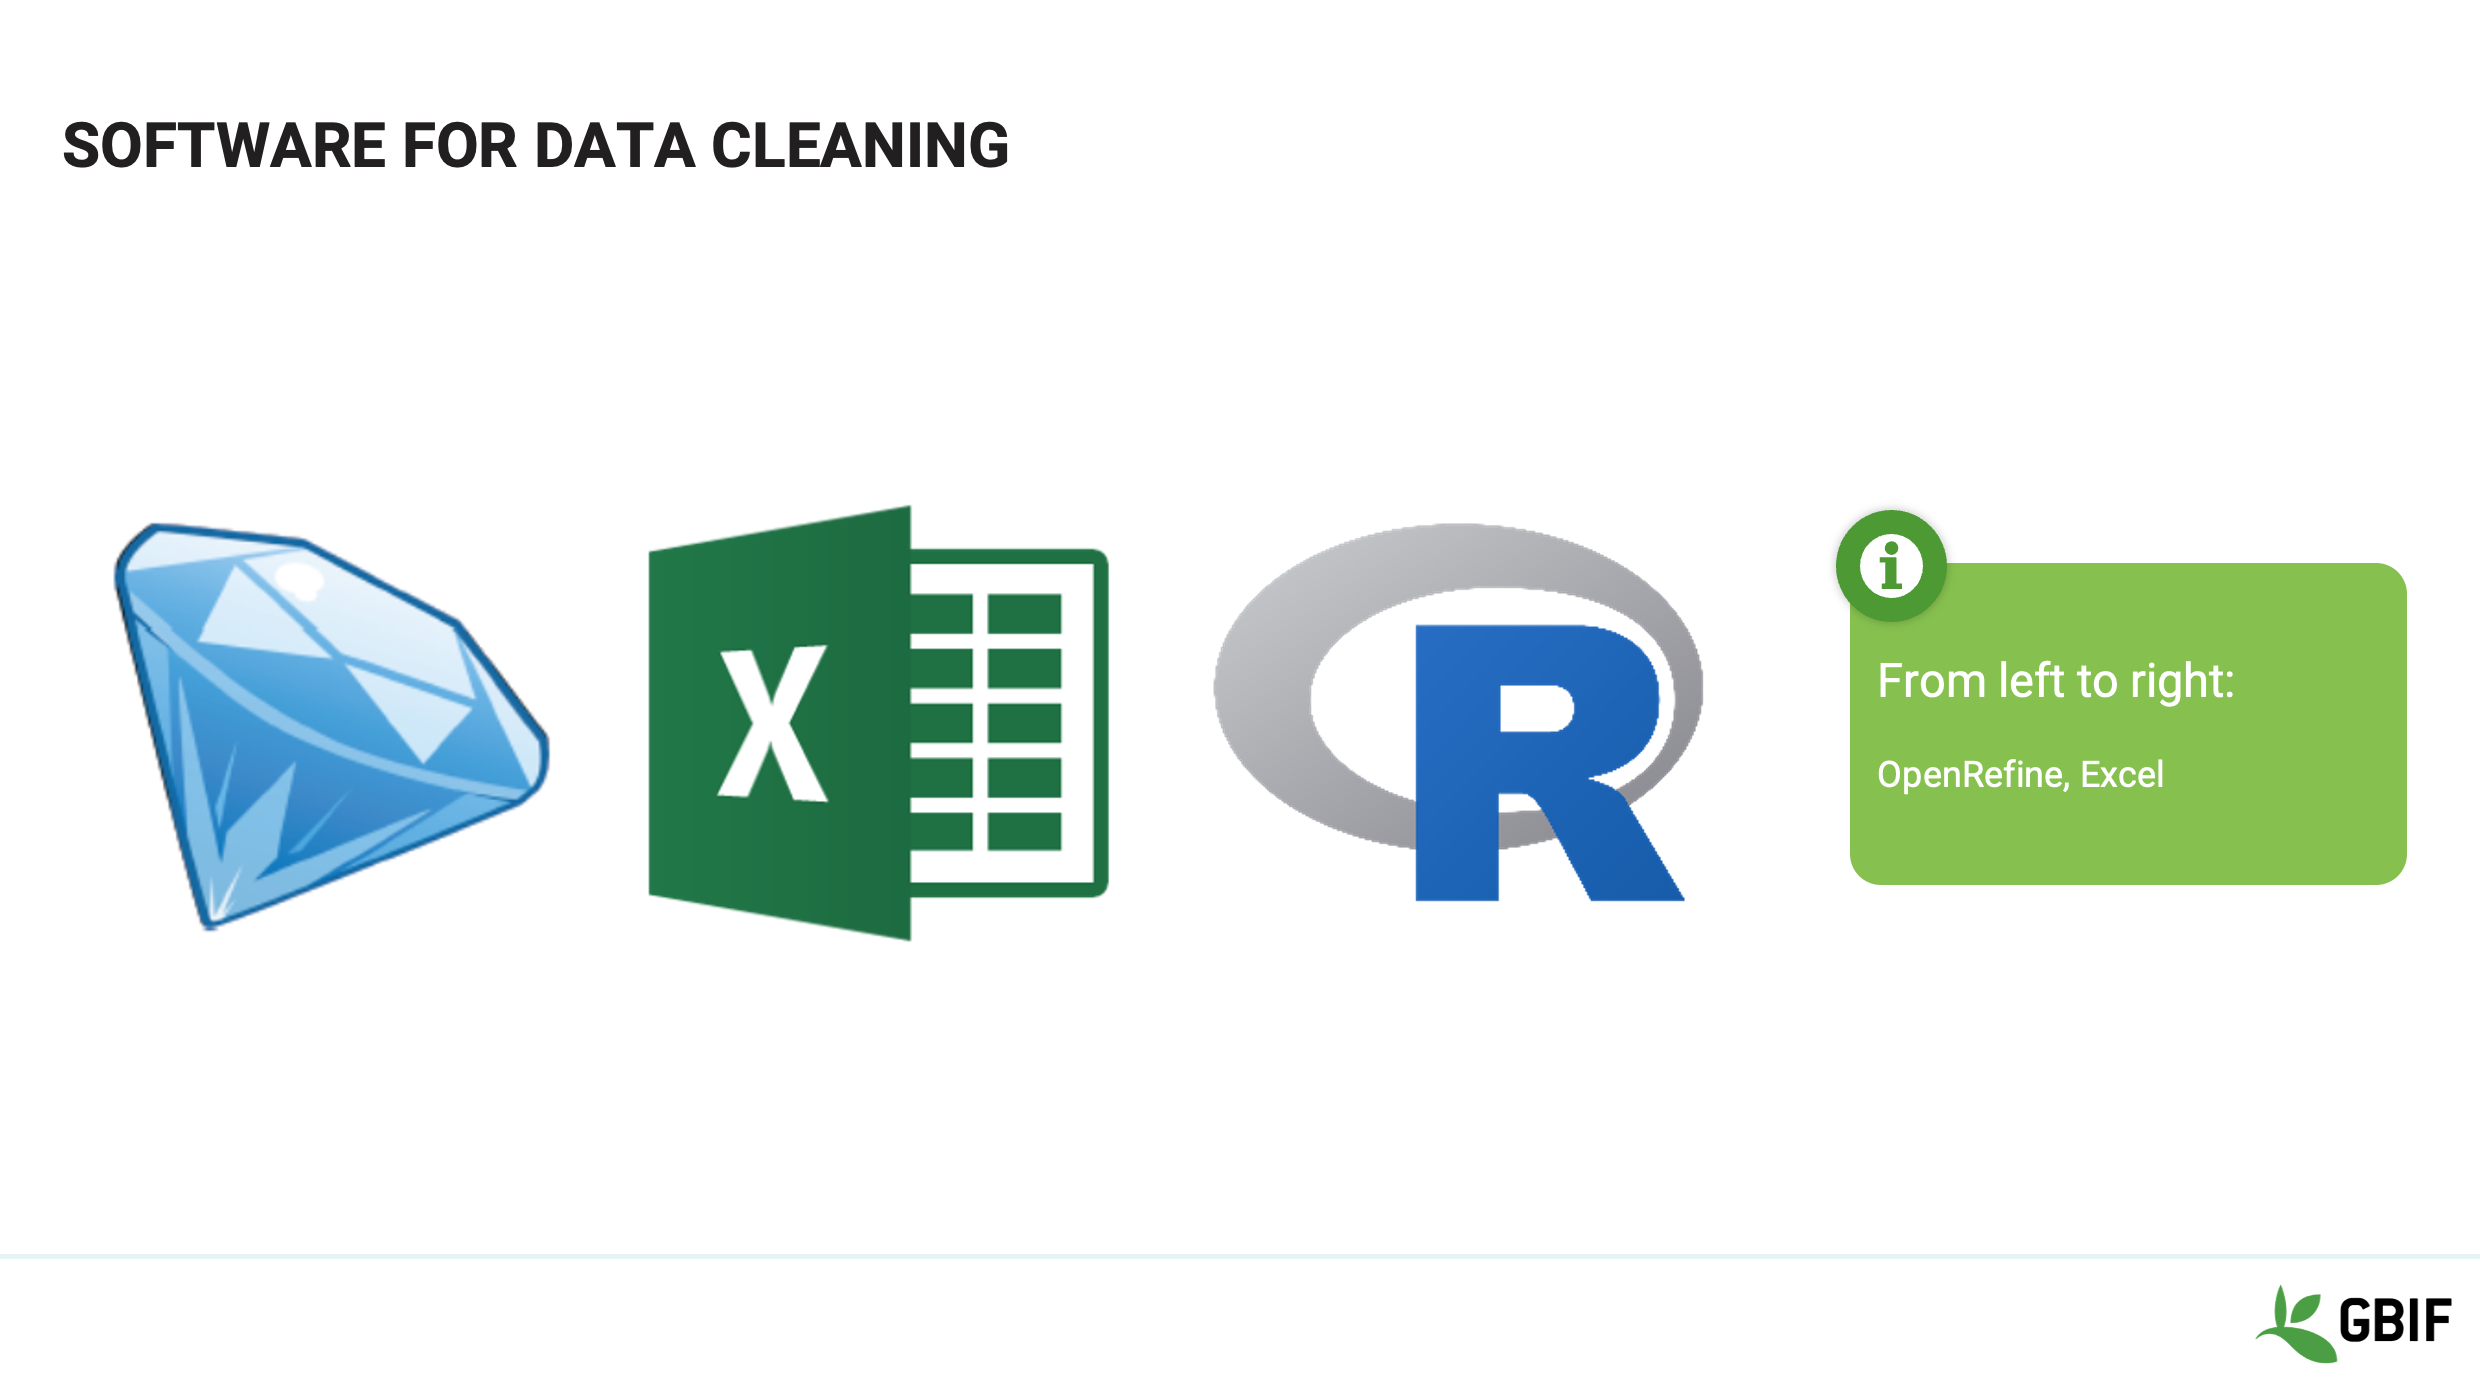
Slide 7 - Software for data cleaning
Increasingly the lines between languages, programs and tools have blurred, each being capable of many complex and overlapping functions. The common “Find and Replace” function is a good example of a data cleaning tool that is found in almost all database programs and is a command in database languages.
You are probably already familiar with spreadsheets such as Excel and indeed these are probably the most common data cleaning tools available. However there are others.
OpenRefine originally known as GoogleRefine is a powerful free, open source data cleaning tool with a large support community. You will see more of this program in upcoming sessions.
R is another increasing used, sophisticated programming language and environment. With a little practice it can also provide powerful data manipulations.
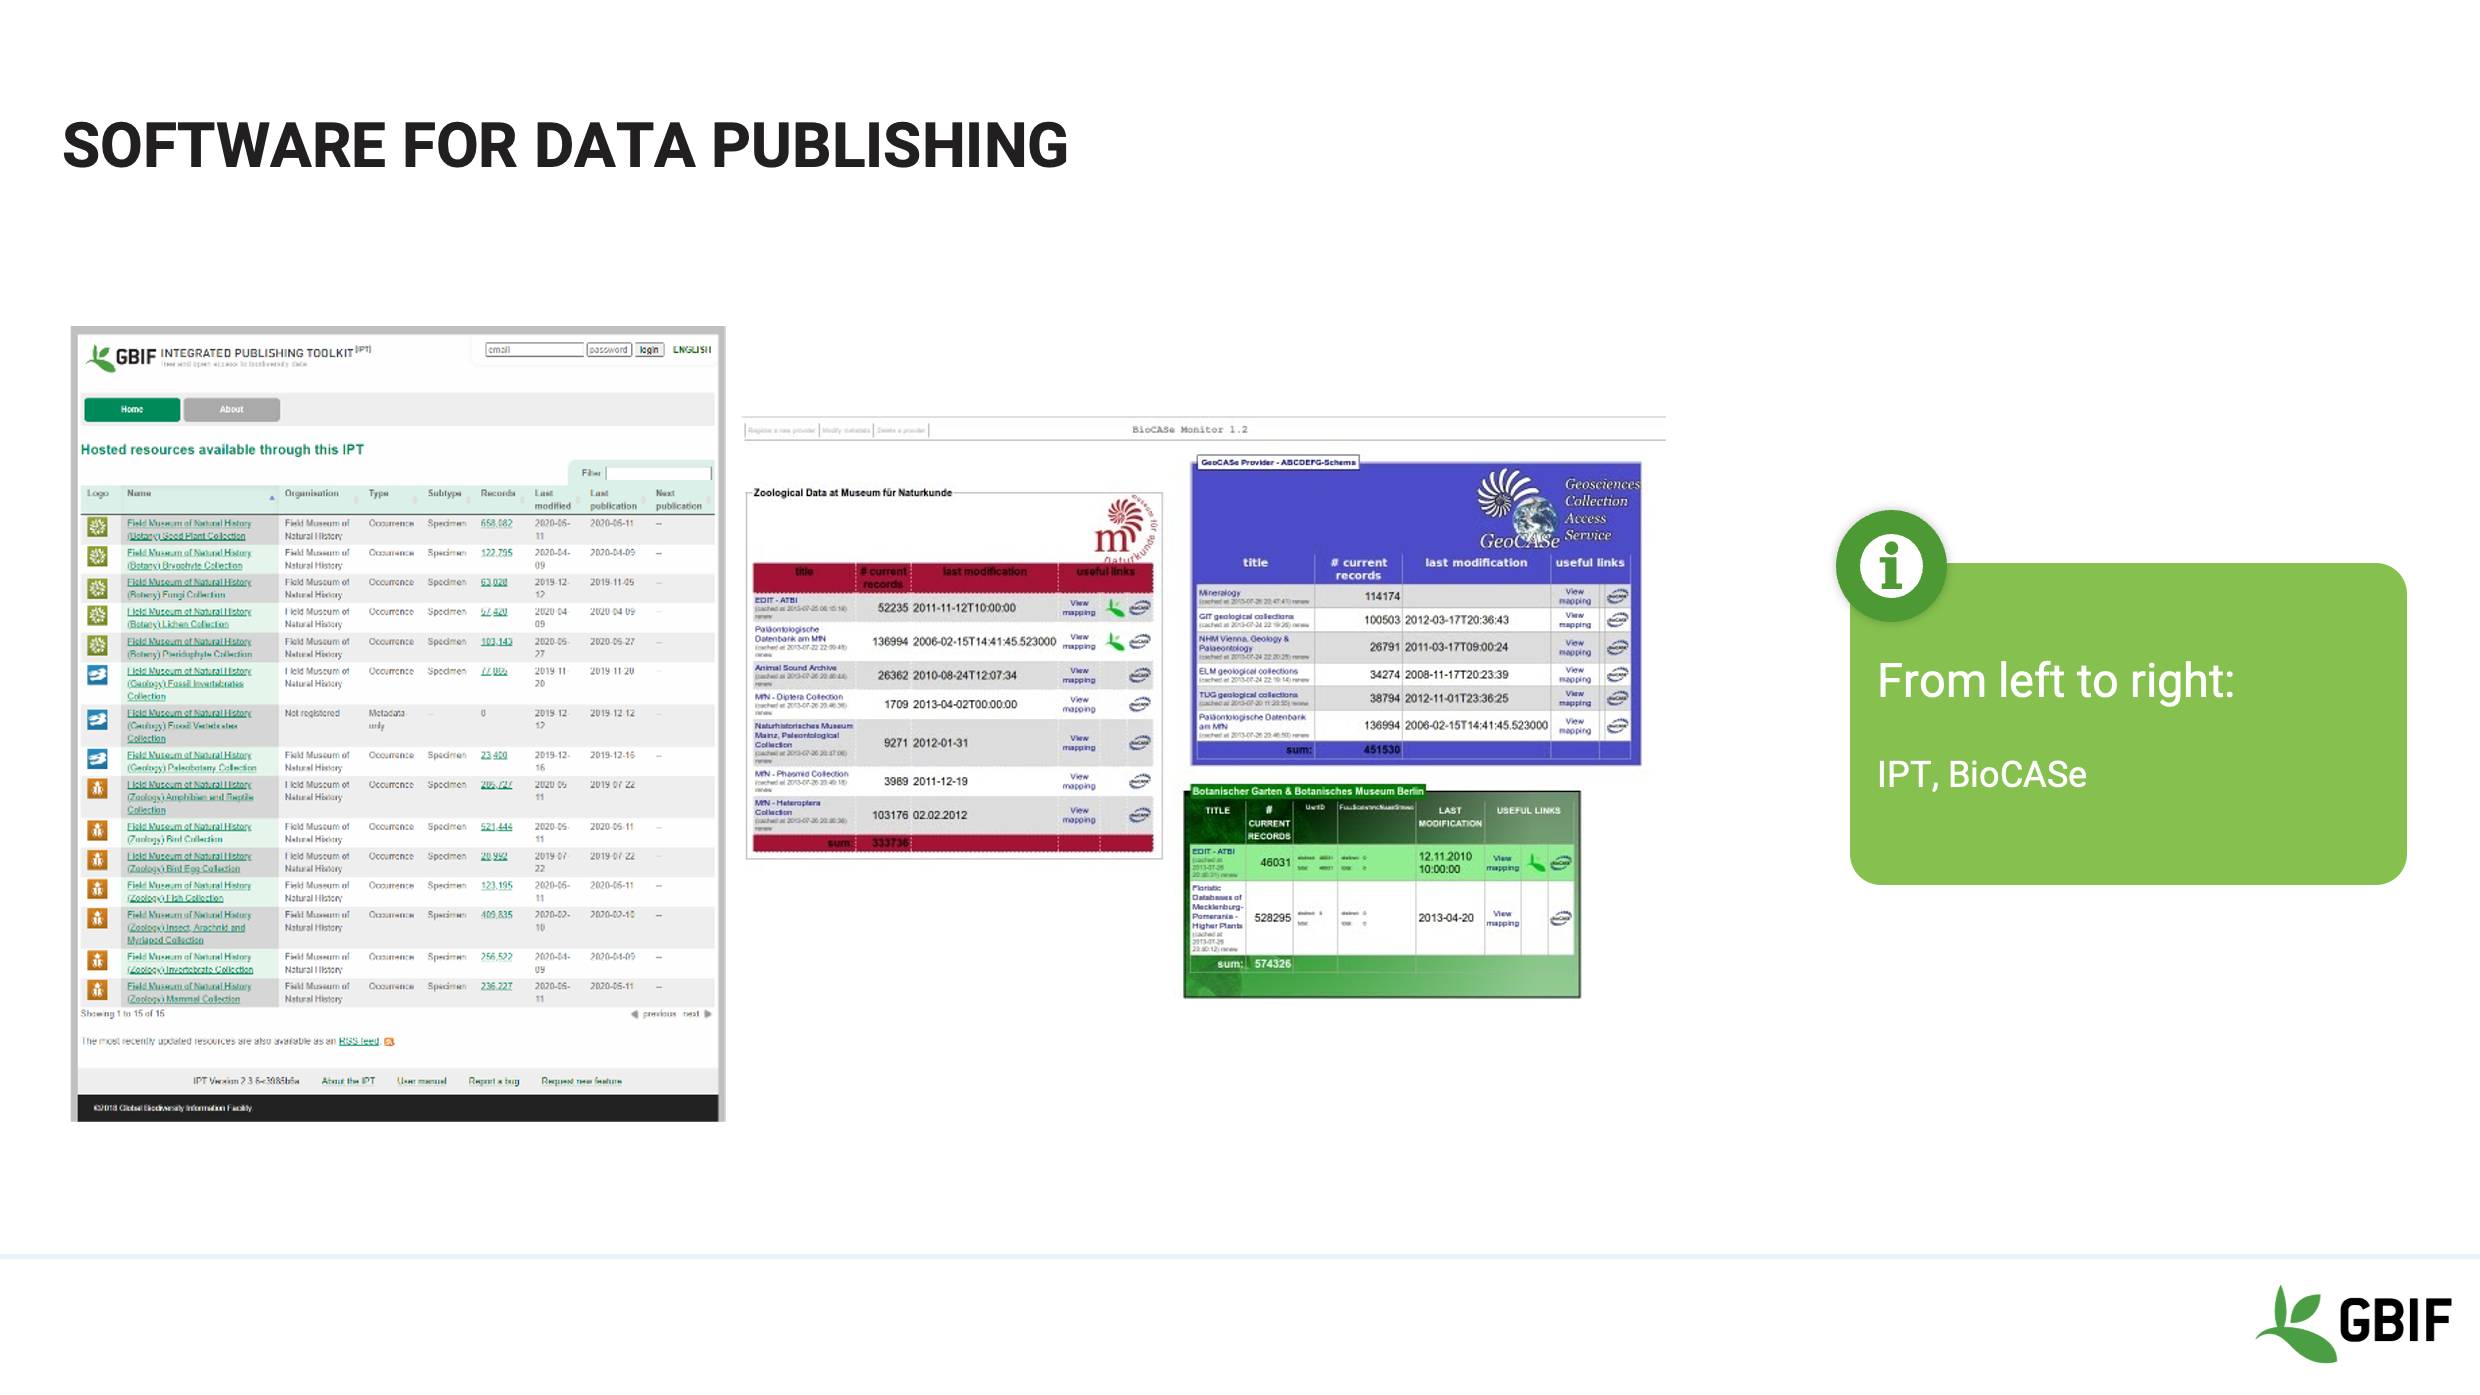
Slide 8 - Software for data publishing
Planning further ahead to the sharing of your data through GBIF to the international scientific and deciders community you will need to choose a publishing tool.
The choice will depend largely on the level of infrastructure support at your institution. If this is high and stable, installing an IPT or BioCASe application may be the right option. But there are others if this is not the case.
You can consider partnering with an existing ipt provider or selecting a database management system that includes a publishing pathway of its own.
Whichever you choose, make sure that your system allows you to export data as csv or txt files and you will ultimately be able to publish your data.
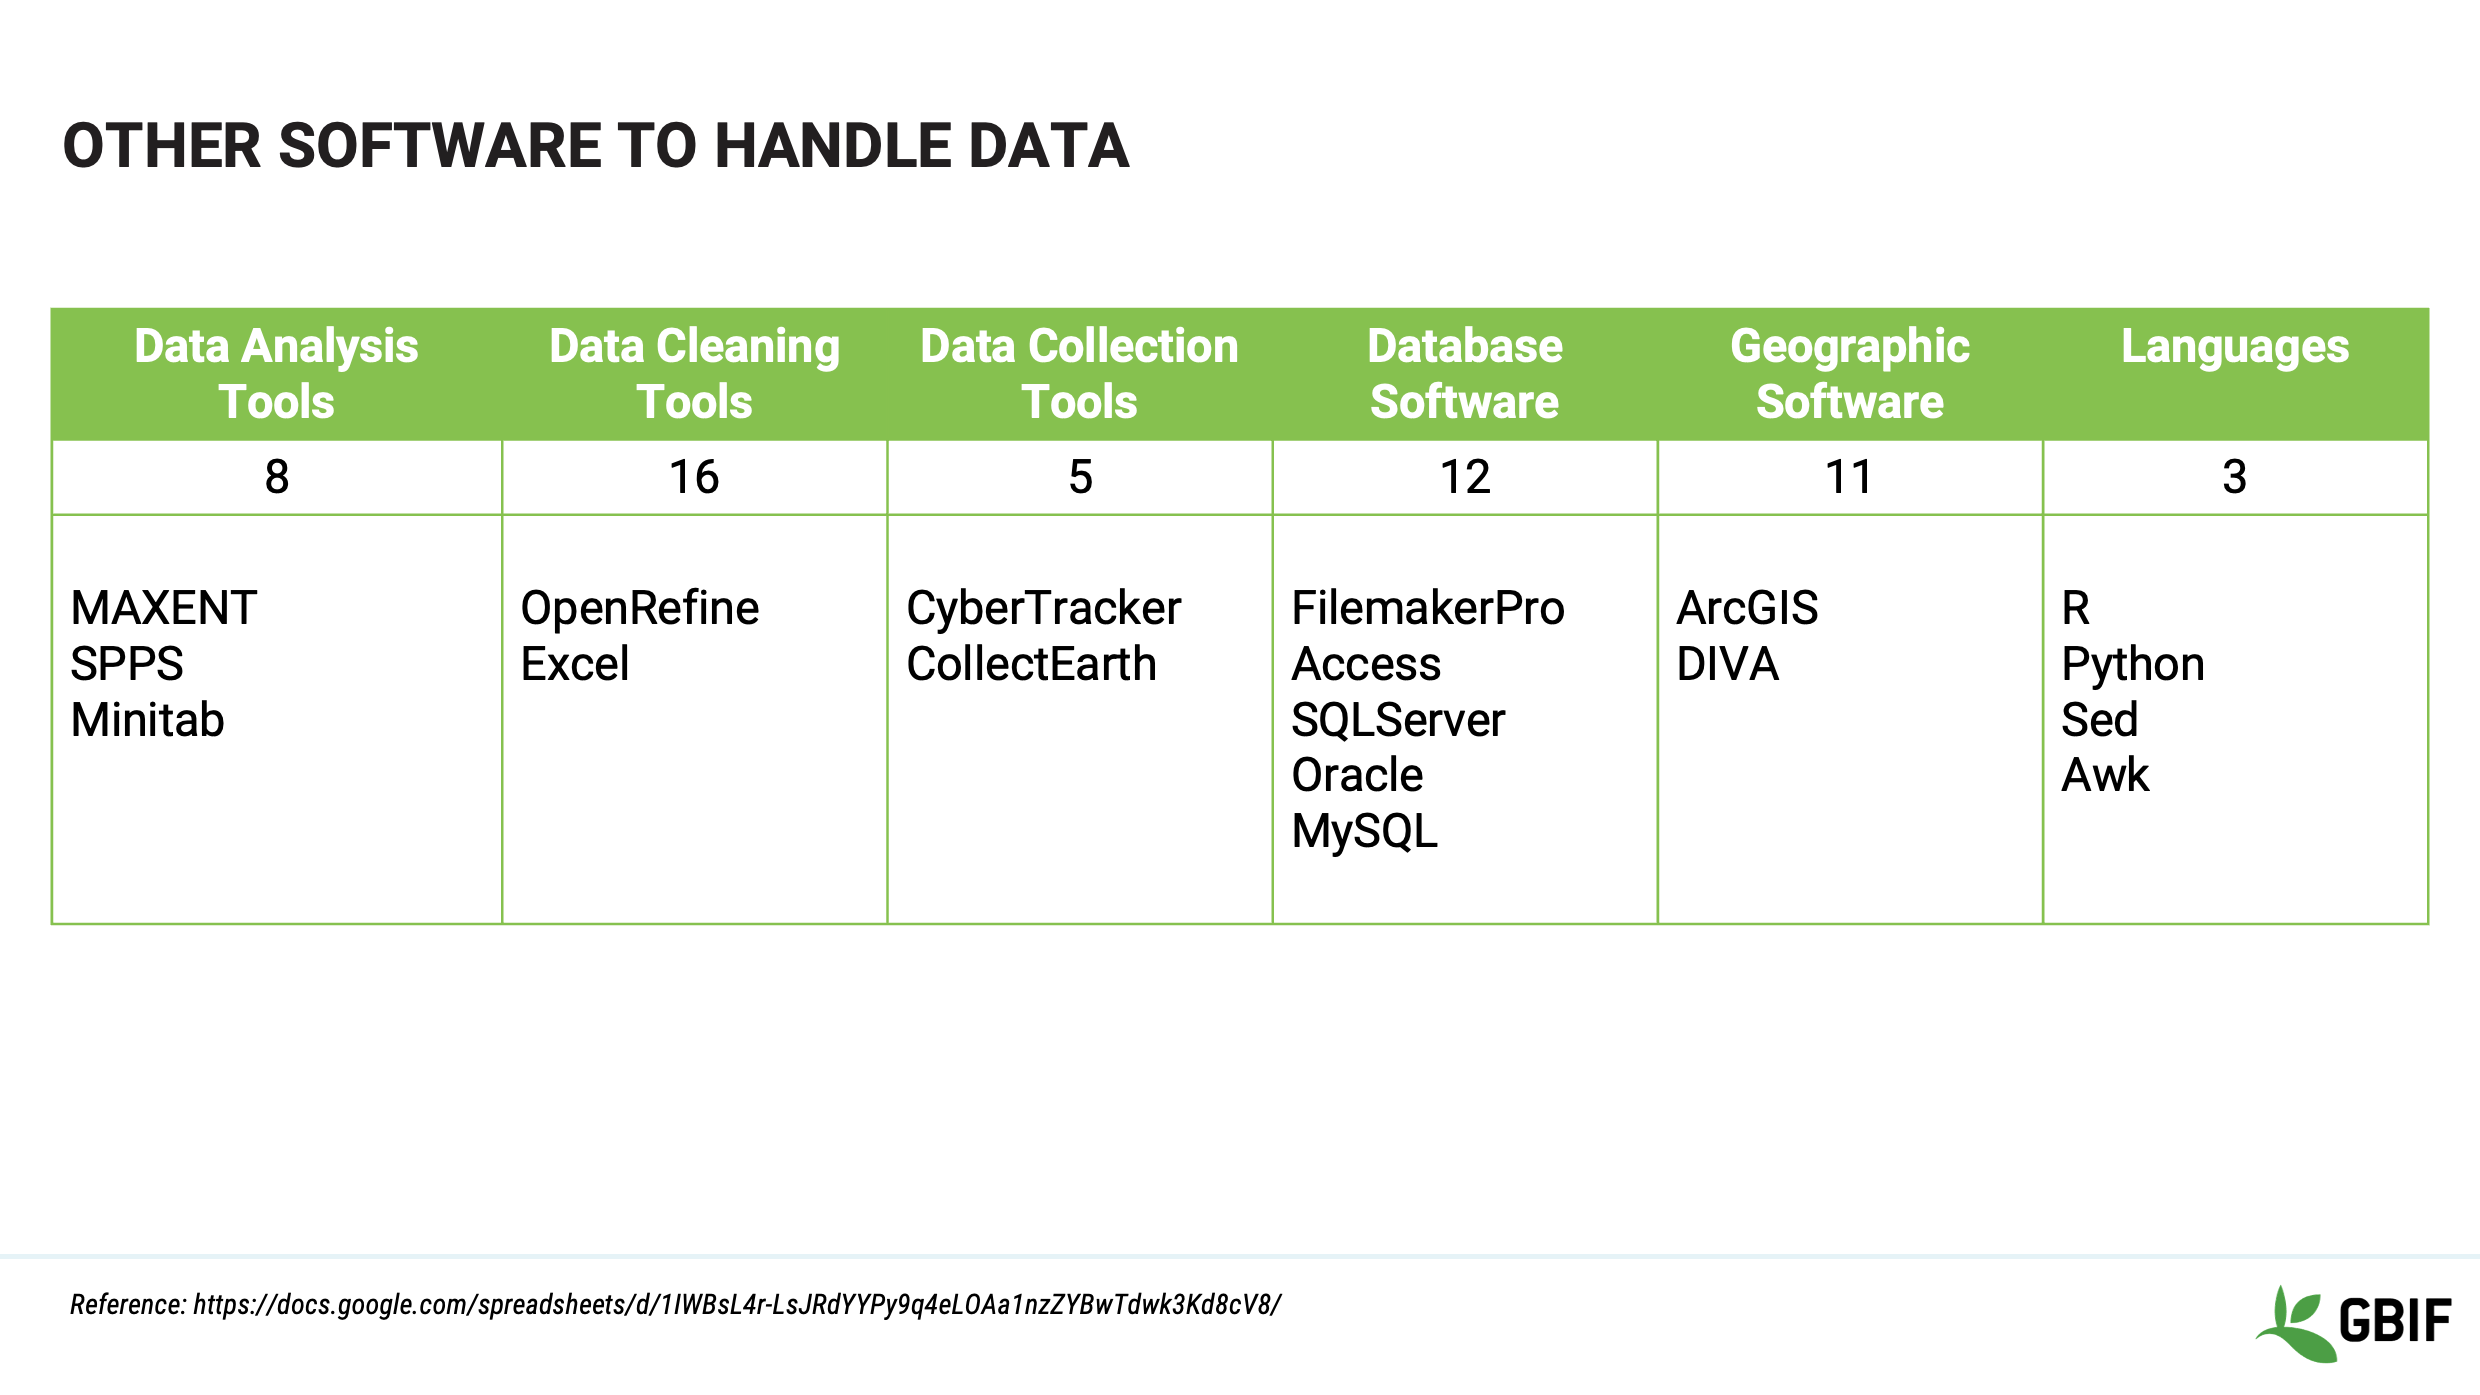
Slide 9 - Other software to handle data
This is a summary of the information collected in the course survey of software in use by students, mentors and trainers in the GBIF community.
The link and reference to more details of each section, is at the bottom of the slide.
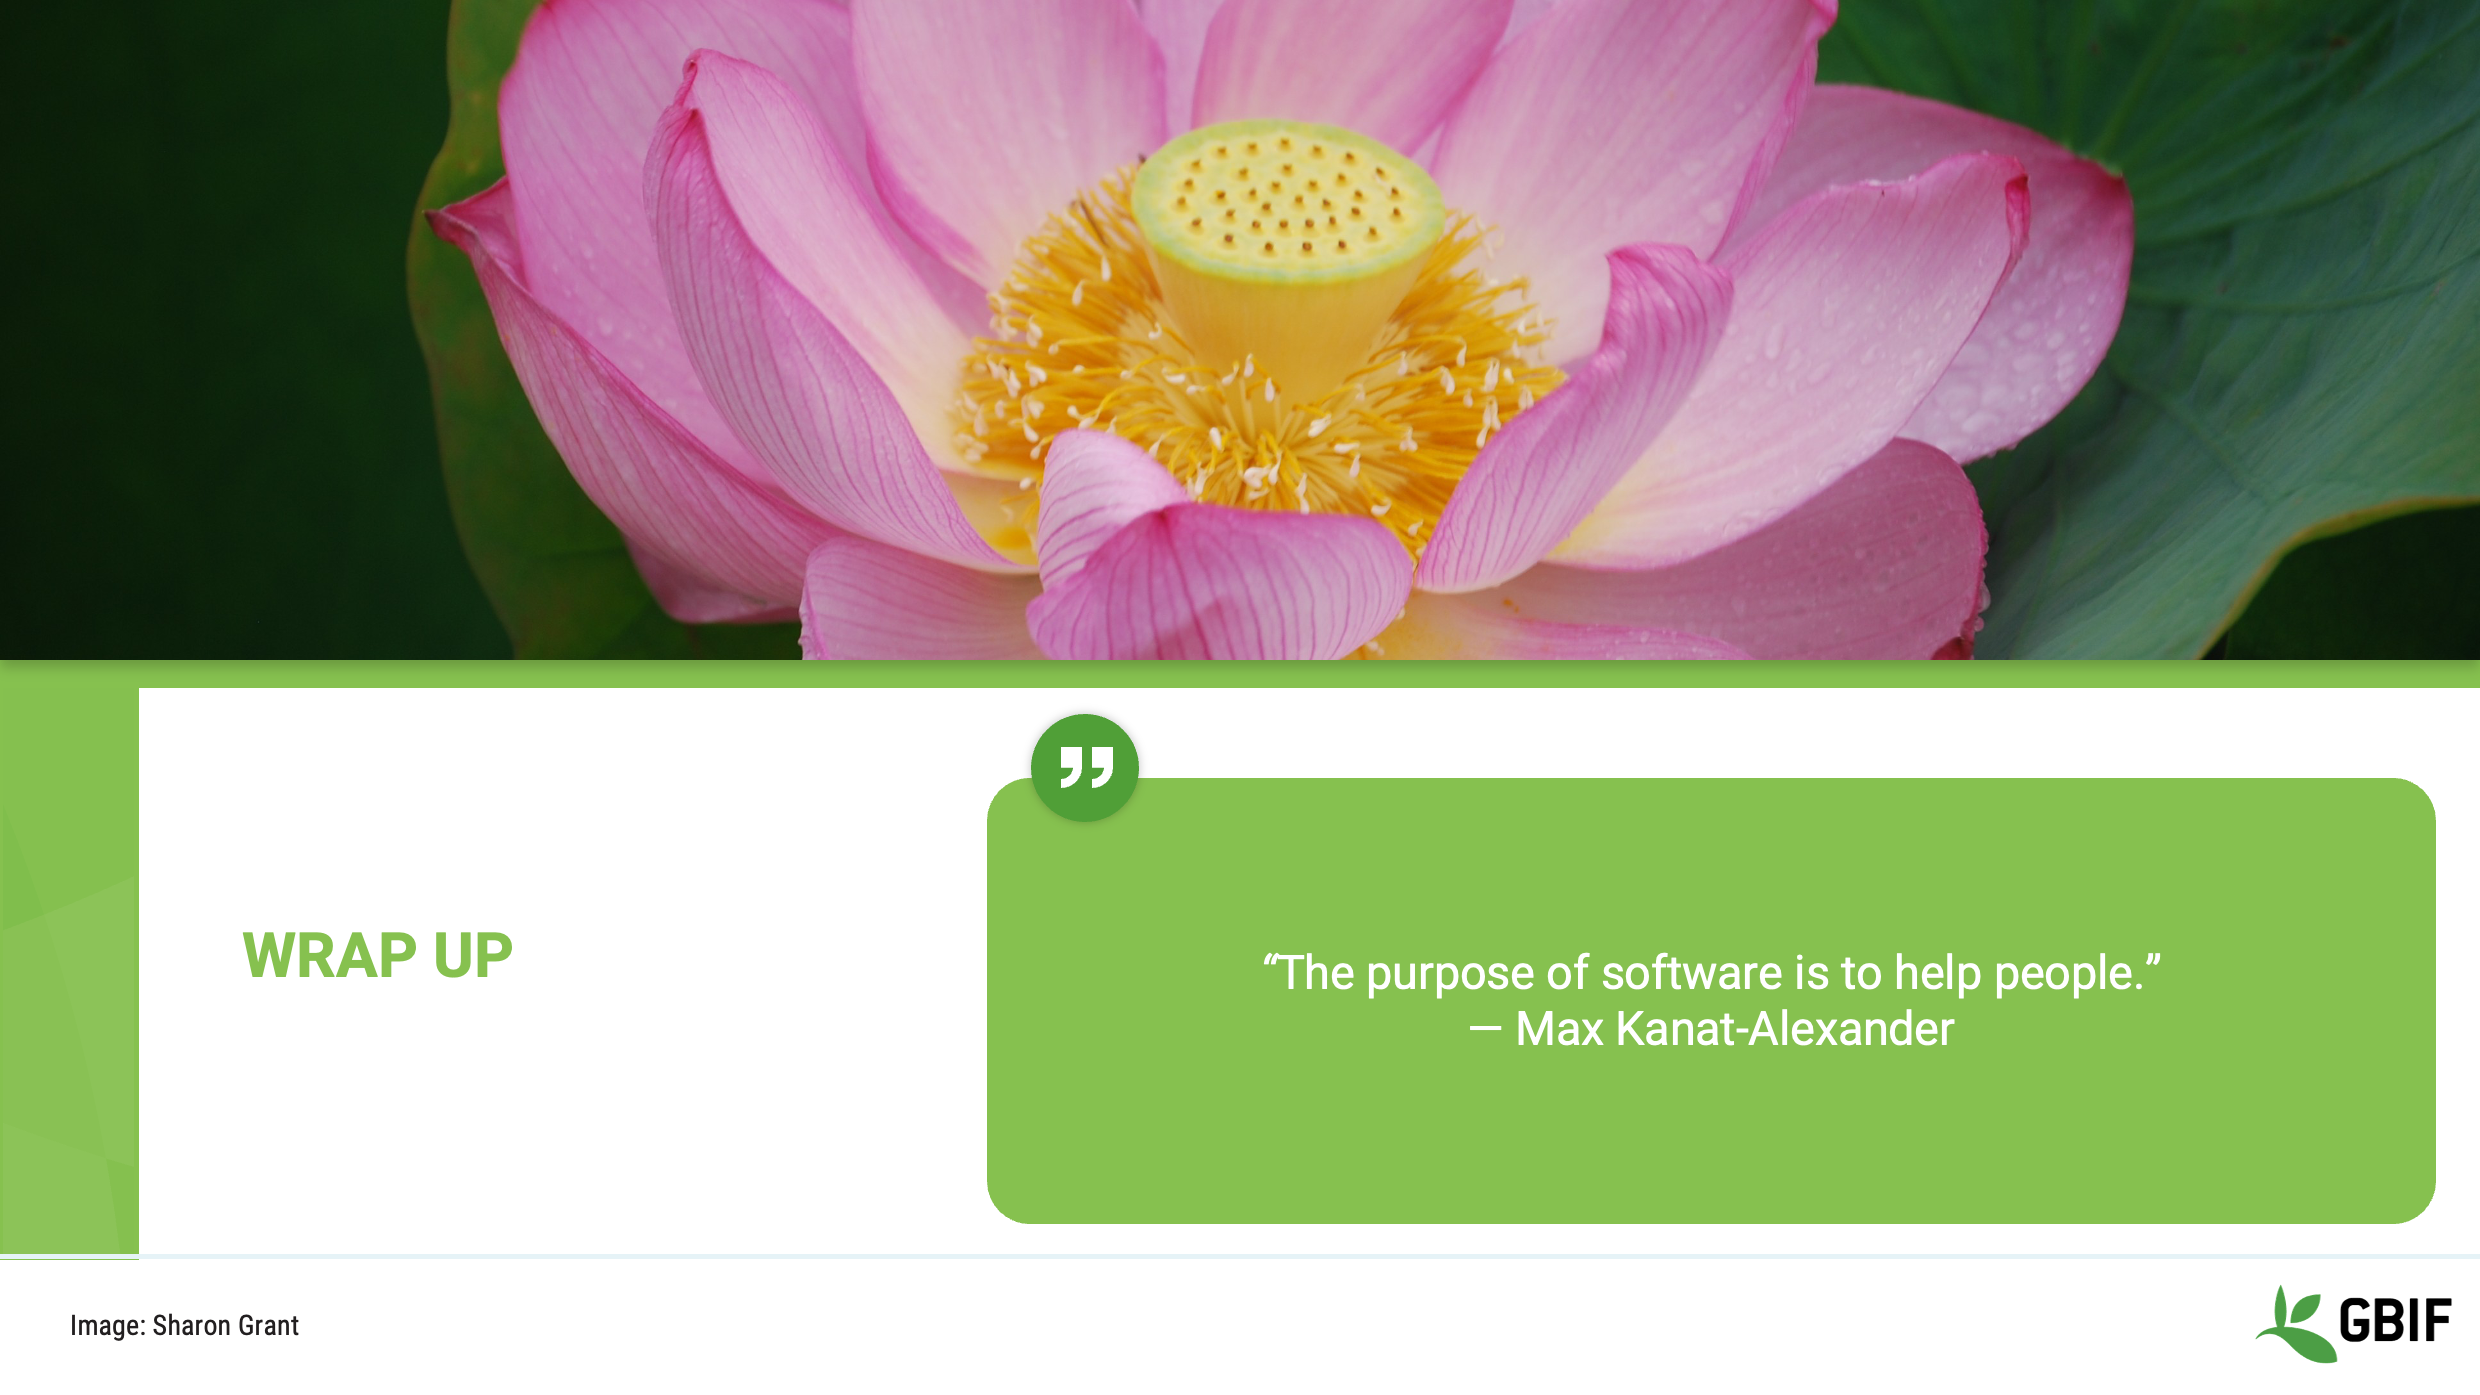
Slide 10 - Wrap-up
Remember that:
“The purpose of software is to help people” and not the other way around.
Your choice of solution should make your life easier but it should also not sacrifice the long term viability of the data that it is meant to work with.

Slide 11 - Conclusion
This video is part of a series of presentations used in the GBIF Biodiversity Data Mobilization course. The biodiversity data mobilization curriculum was originally developed as part of the Biodiversity Information Development Programme funded by the European Union.
This presentation was narrated by Sharon Grant with additional contributions by BID and BIFA Trainers, Mentors and Students.
Structures
|
In this video (13:10), you will review the field and data types that hold data, the structures that help to organize and protect that data and what these mean for the integrity and security of your data. If you are unable to watch the embedded video, you can download it locally. (MP4 - 44.4 MB) |
Presentation transcript
Click to expand
Slide 1 - Foundations - Structures terminology
This session is foundation work and part of the Terminology section. We will be introducing you to the language, terminology and definitions for some of the basic concepts, functions and processes that you are going to be putting into use during the rest of the course.
Image by Carsten Witzel, obtained via http://www.freeimages.com/photo/root-of-a-tree-1371557.
Slide 2 - Key concepts
First let’s review the structure of this session.
In the section on STRUCTURES we will be working on understanding the field and data types that hold data, the structures that help to organize and protect that data and lastly look at what these mean for the integrity and security of your data.
Slide 3 - Structures
In this section on basic database Structures we will focus on the different elements that databases, software tools and languages use to handle the data that you enter.
Slide 4 - Structures - Planes, trains and automobiles
First, lets look at field types, also known as data types.
Slide 5 - Containers – field/data types
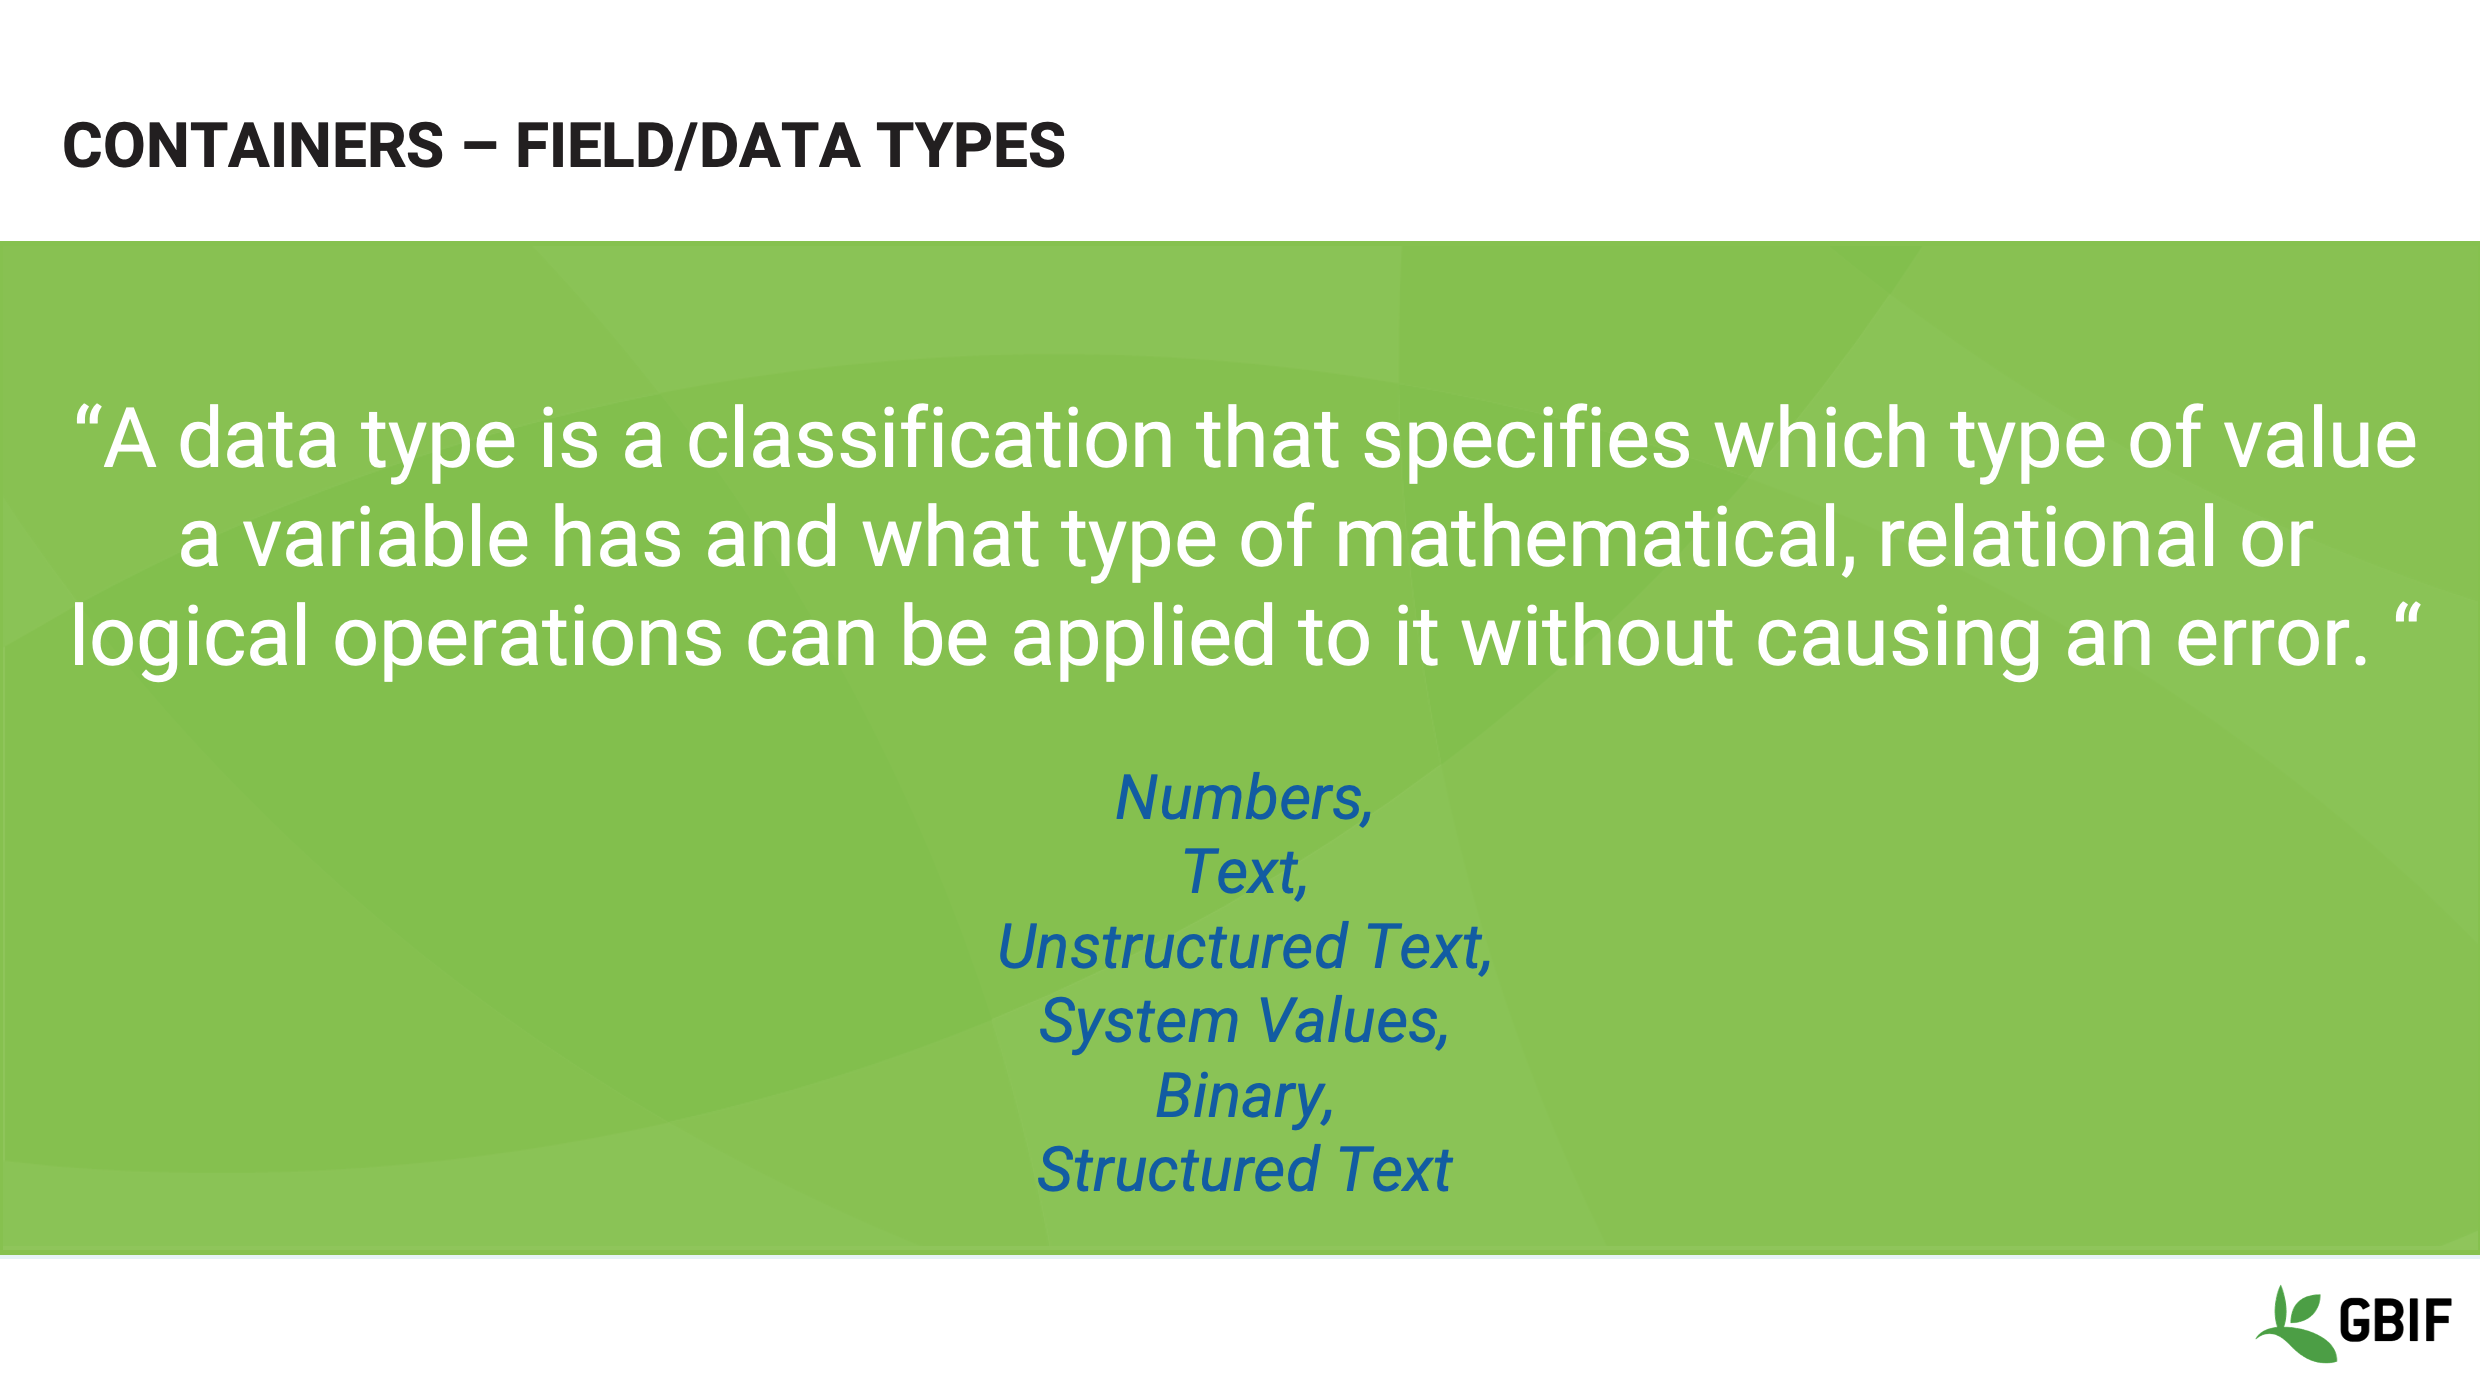
Data Type lets the computer know what kind of data is expected in a particular field. This then dictates what functions can be performed on it.
They can be simple and encompass a single concept or combine concepts depending on the software or language you are using. Either way the essential building blocks are the same.
So let’s look at six that you will come across most frequently.
Slide 6 - Containers – field/data types
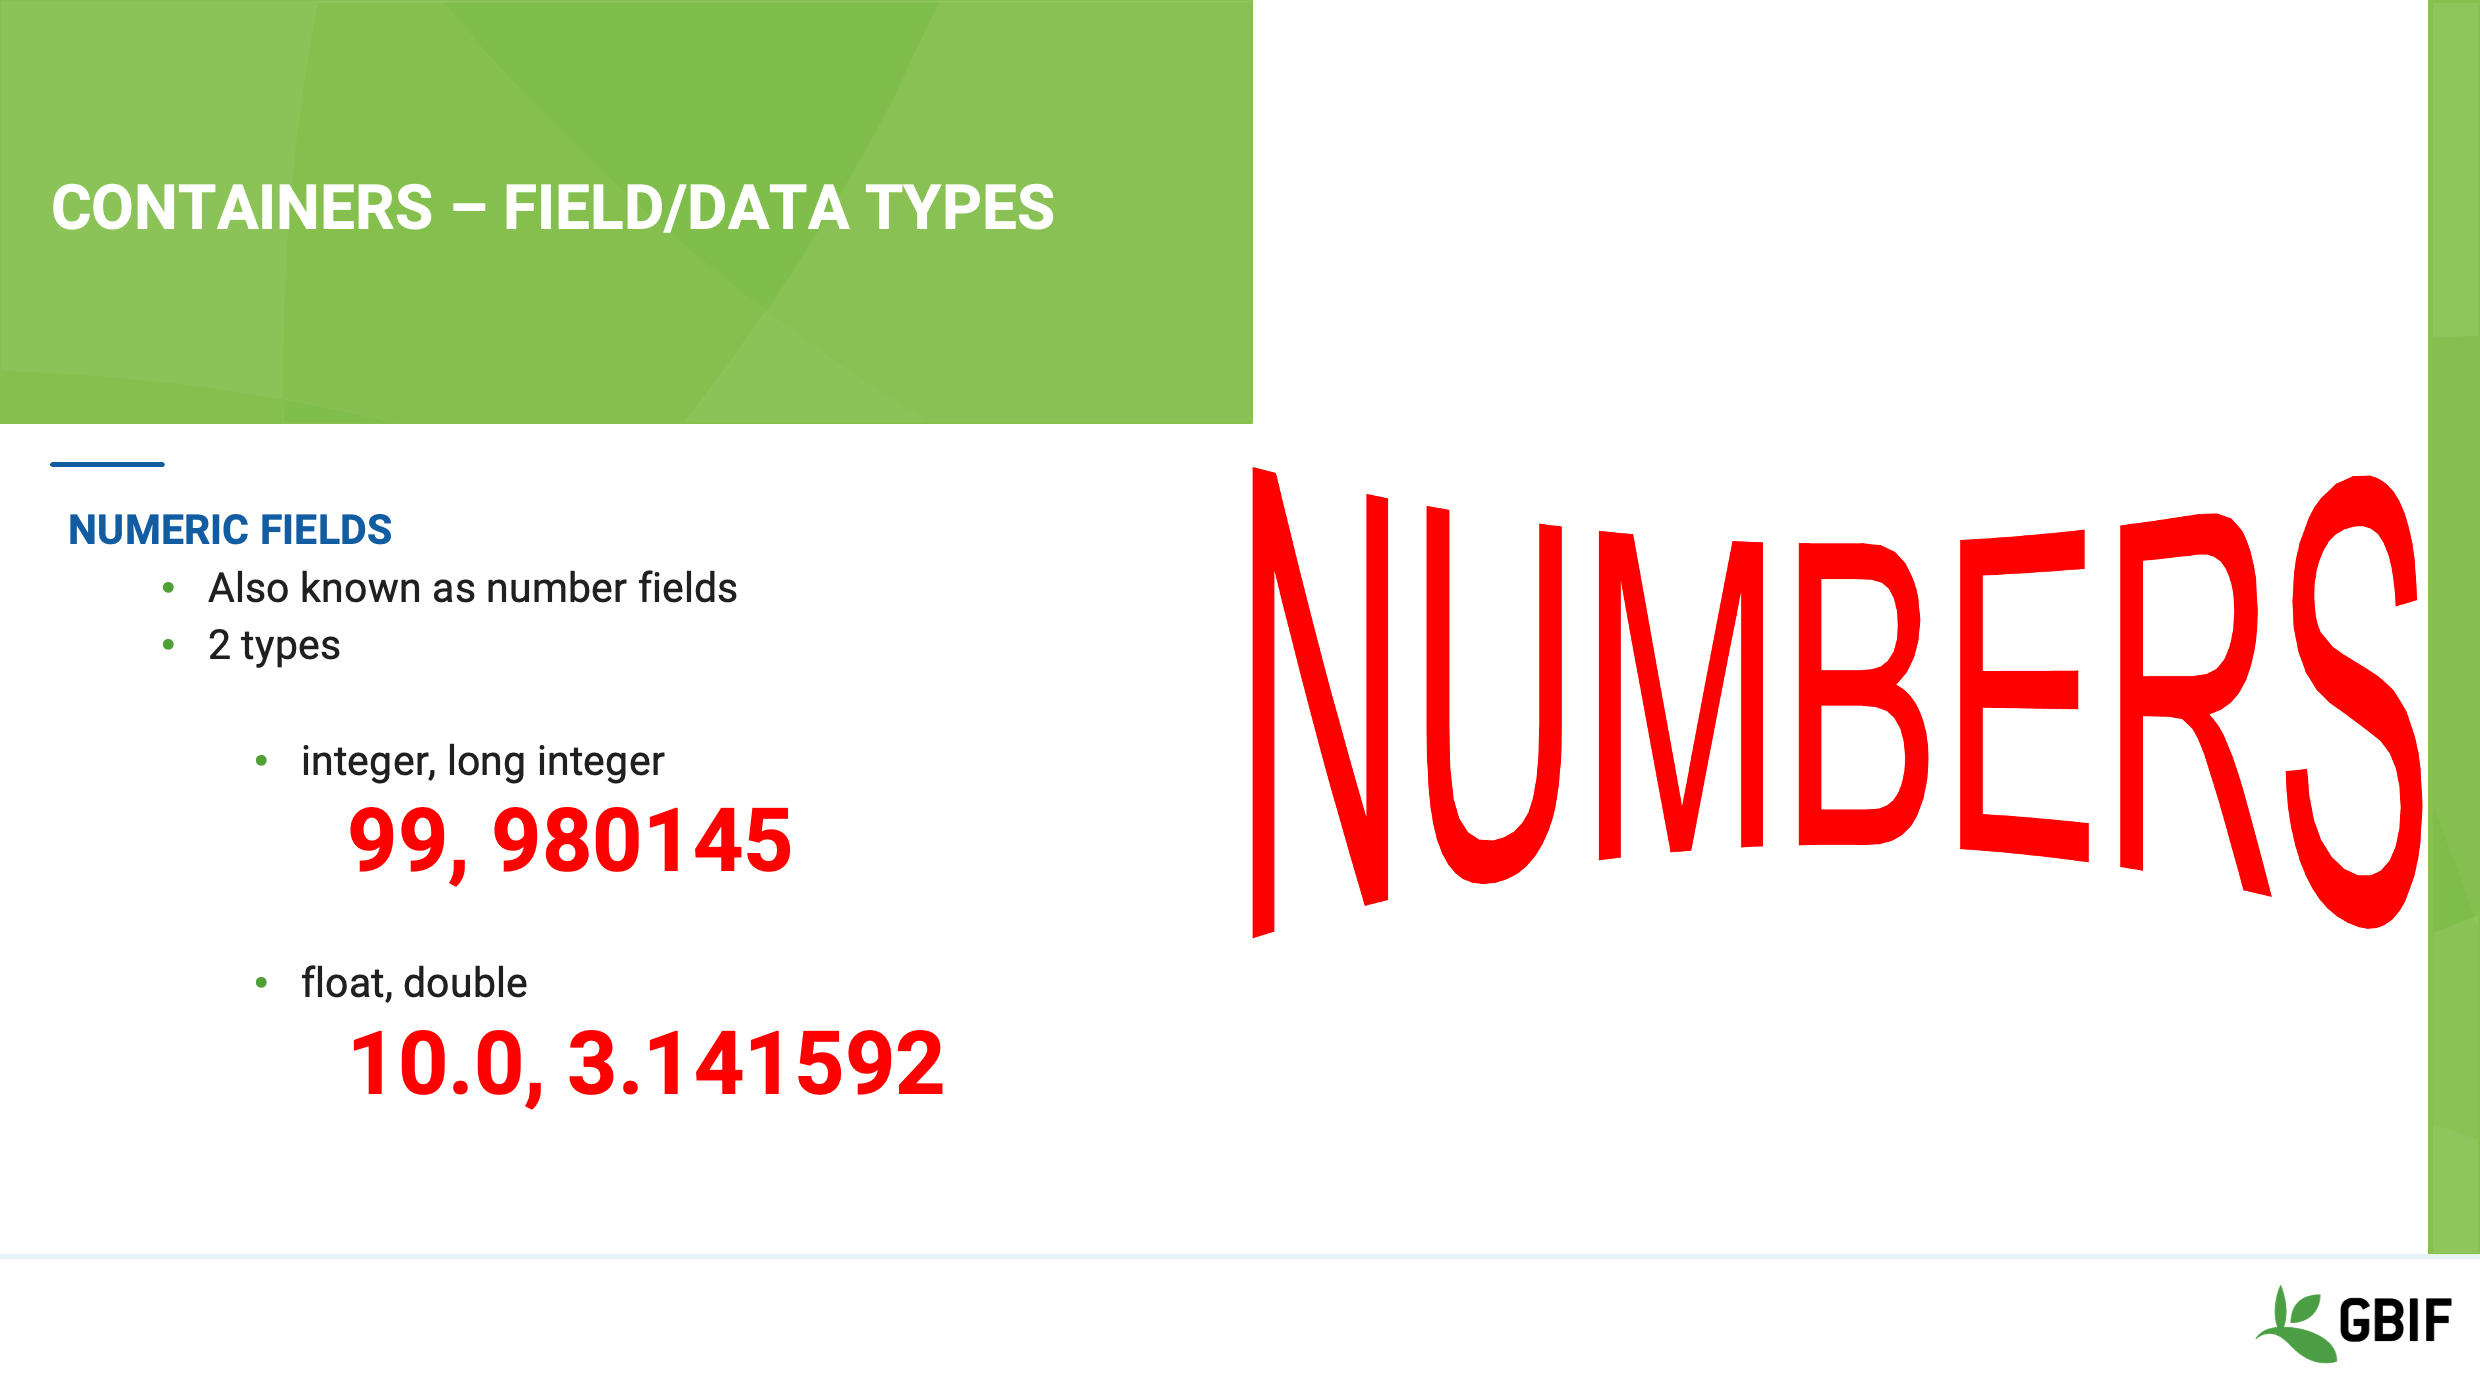
First Numeric fields – This data type holds numbers, and there are 2 kinds:
Integers and long integers, hold whole numbers. For example 1, 2, 3, 99, 2000.
The size of the number, depends on the number of bits assigned to the field (more about that later). For now just remember that a long integer field will hold a bigger number than an integer.
Floats, also referred to as doubles, hold fractions or parts of whole numbers. For example 4.5, 19.47
The important thing to remember here is that a float always has decimal places so the number 10 will be stored as 10.0. The number of decimal places being an integral element of the type. This has implications when it comes to precision and accuracy.
Slide 7 - Containers – field/data types
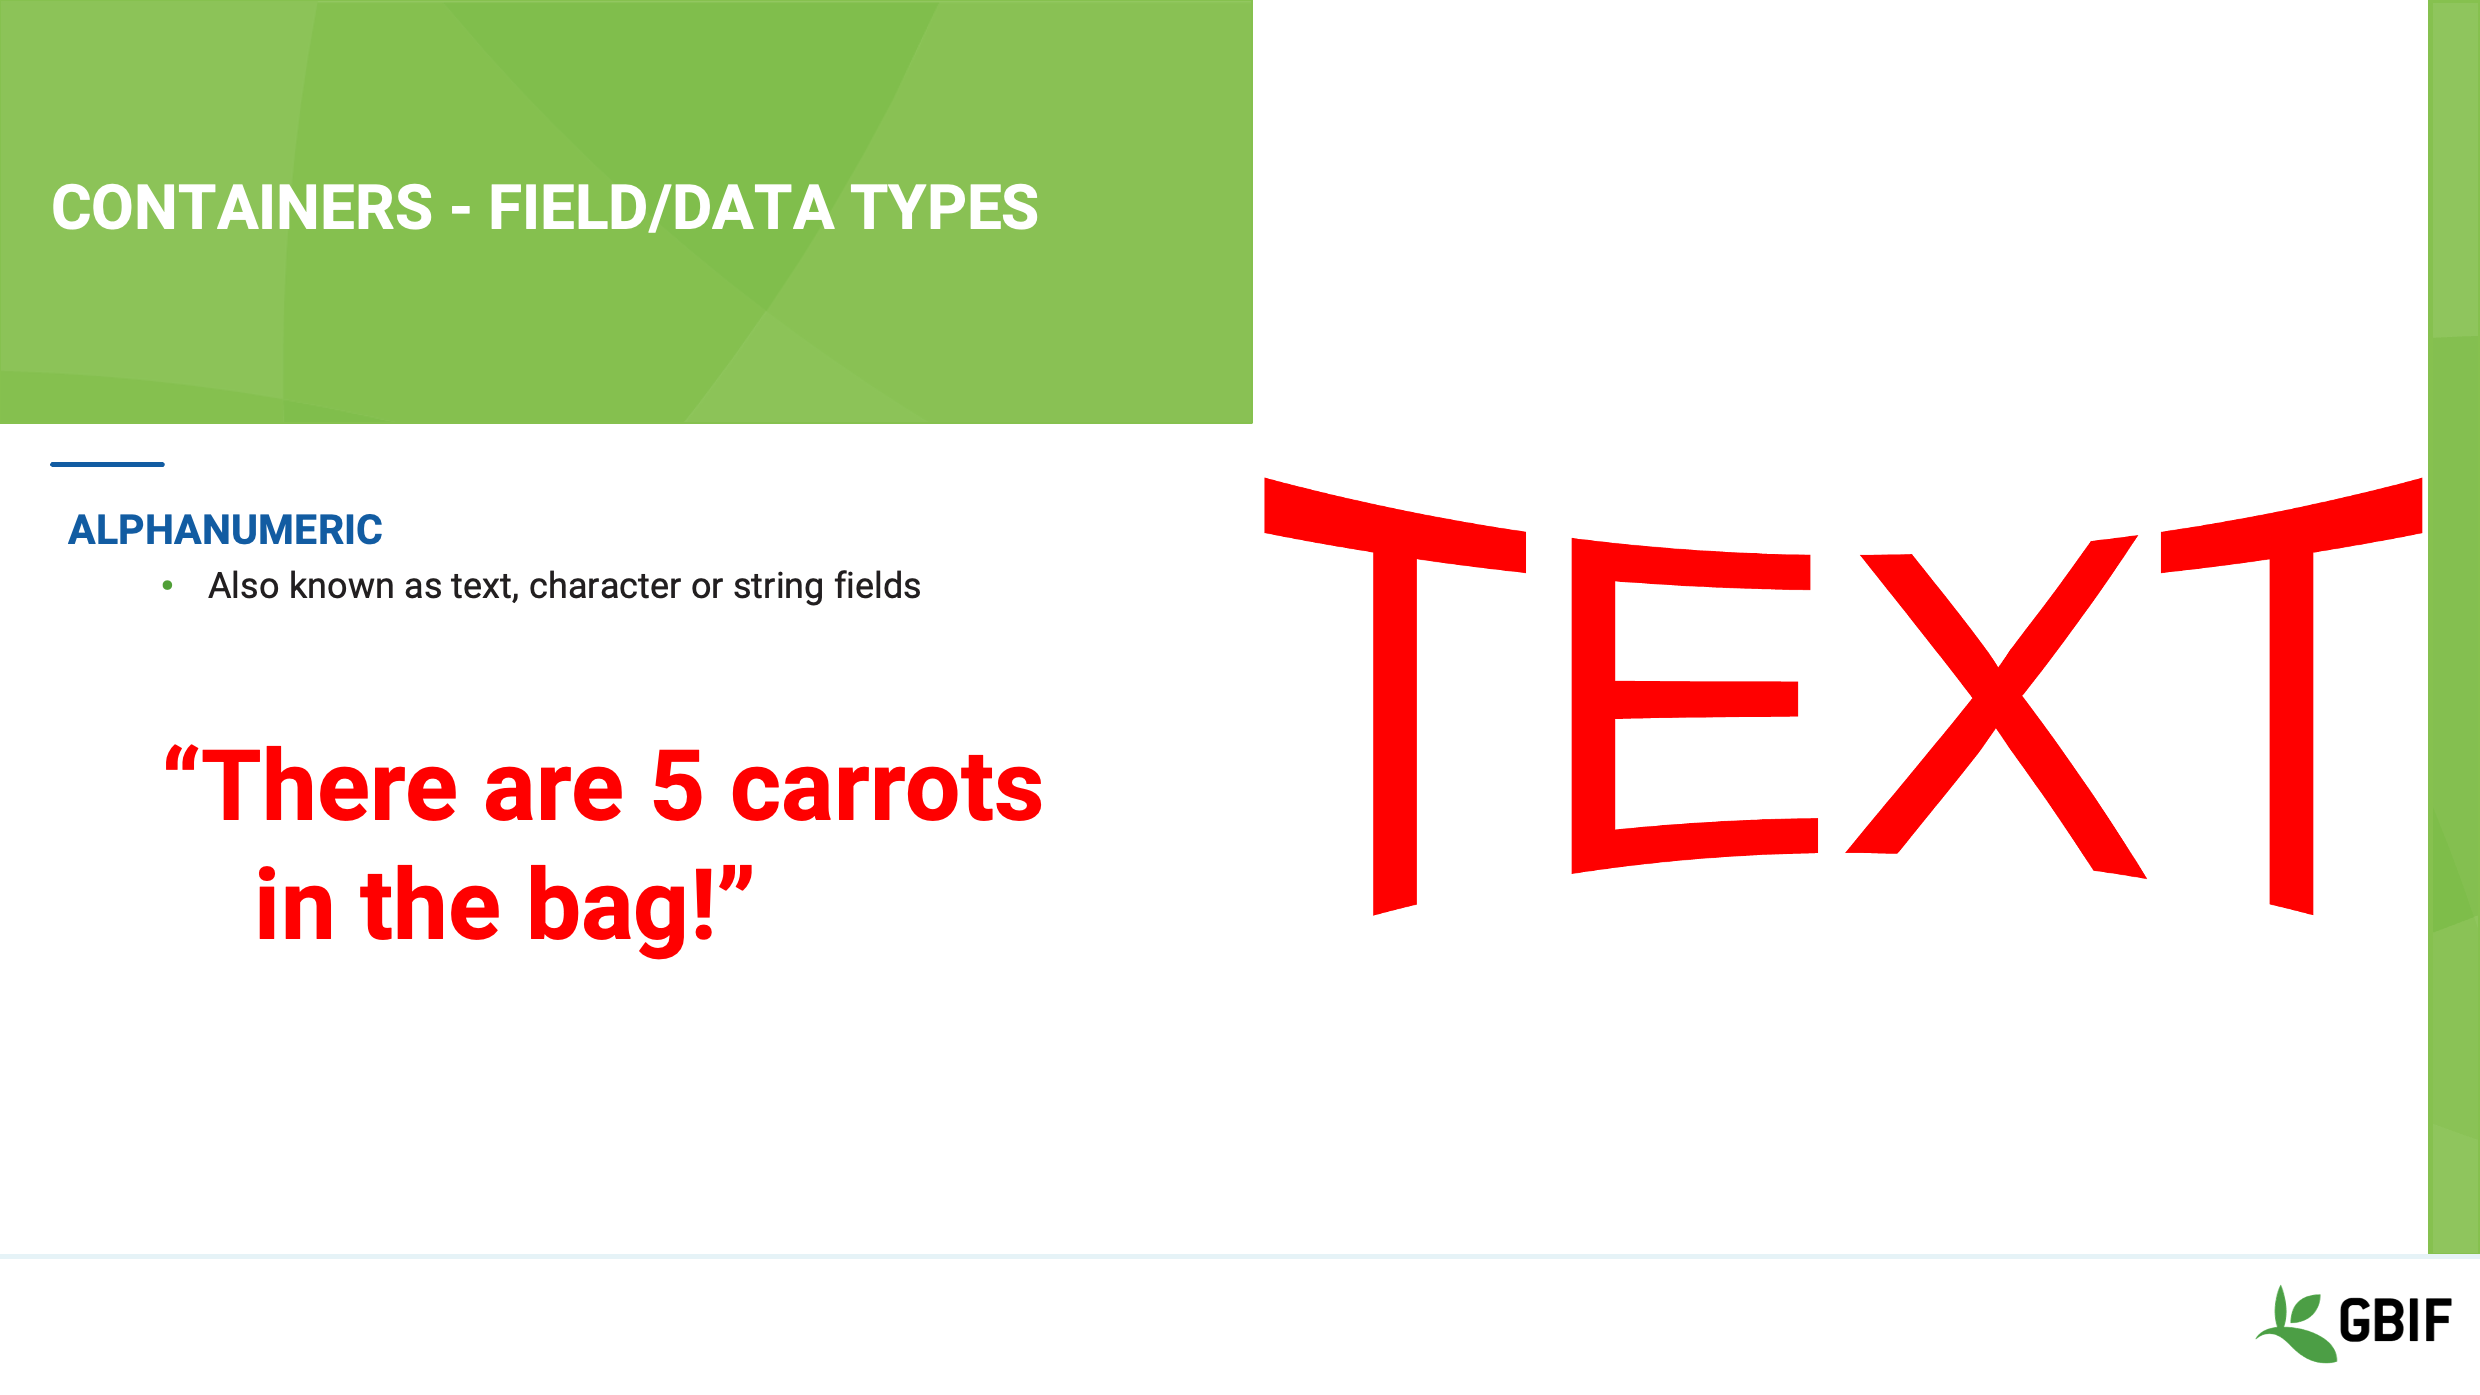
Alphanumeric fields - are also referred to as text, character or string fields.
They can hold any letter, number or symbol in the coded character set and usually have a defined character limit. Entering more characters than the character limit can often result in truncation and loss of data on save.
Slide 8 - Containers – field/data types
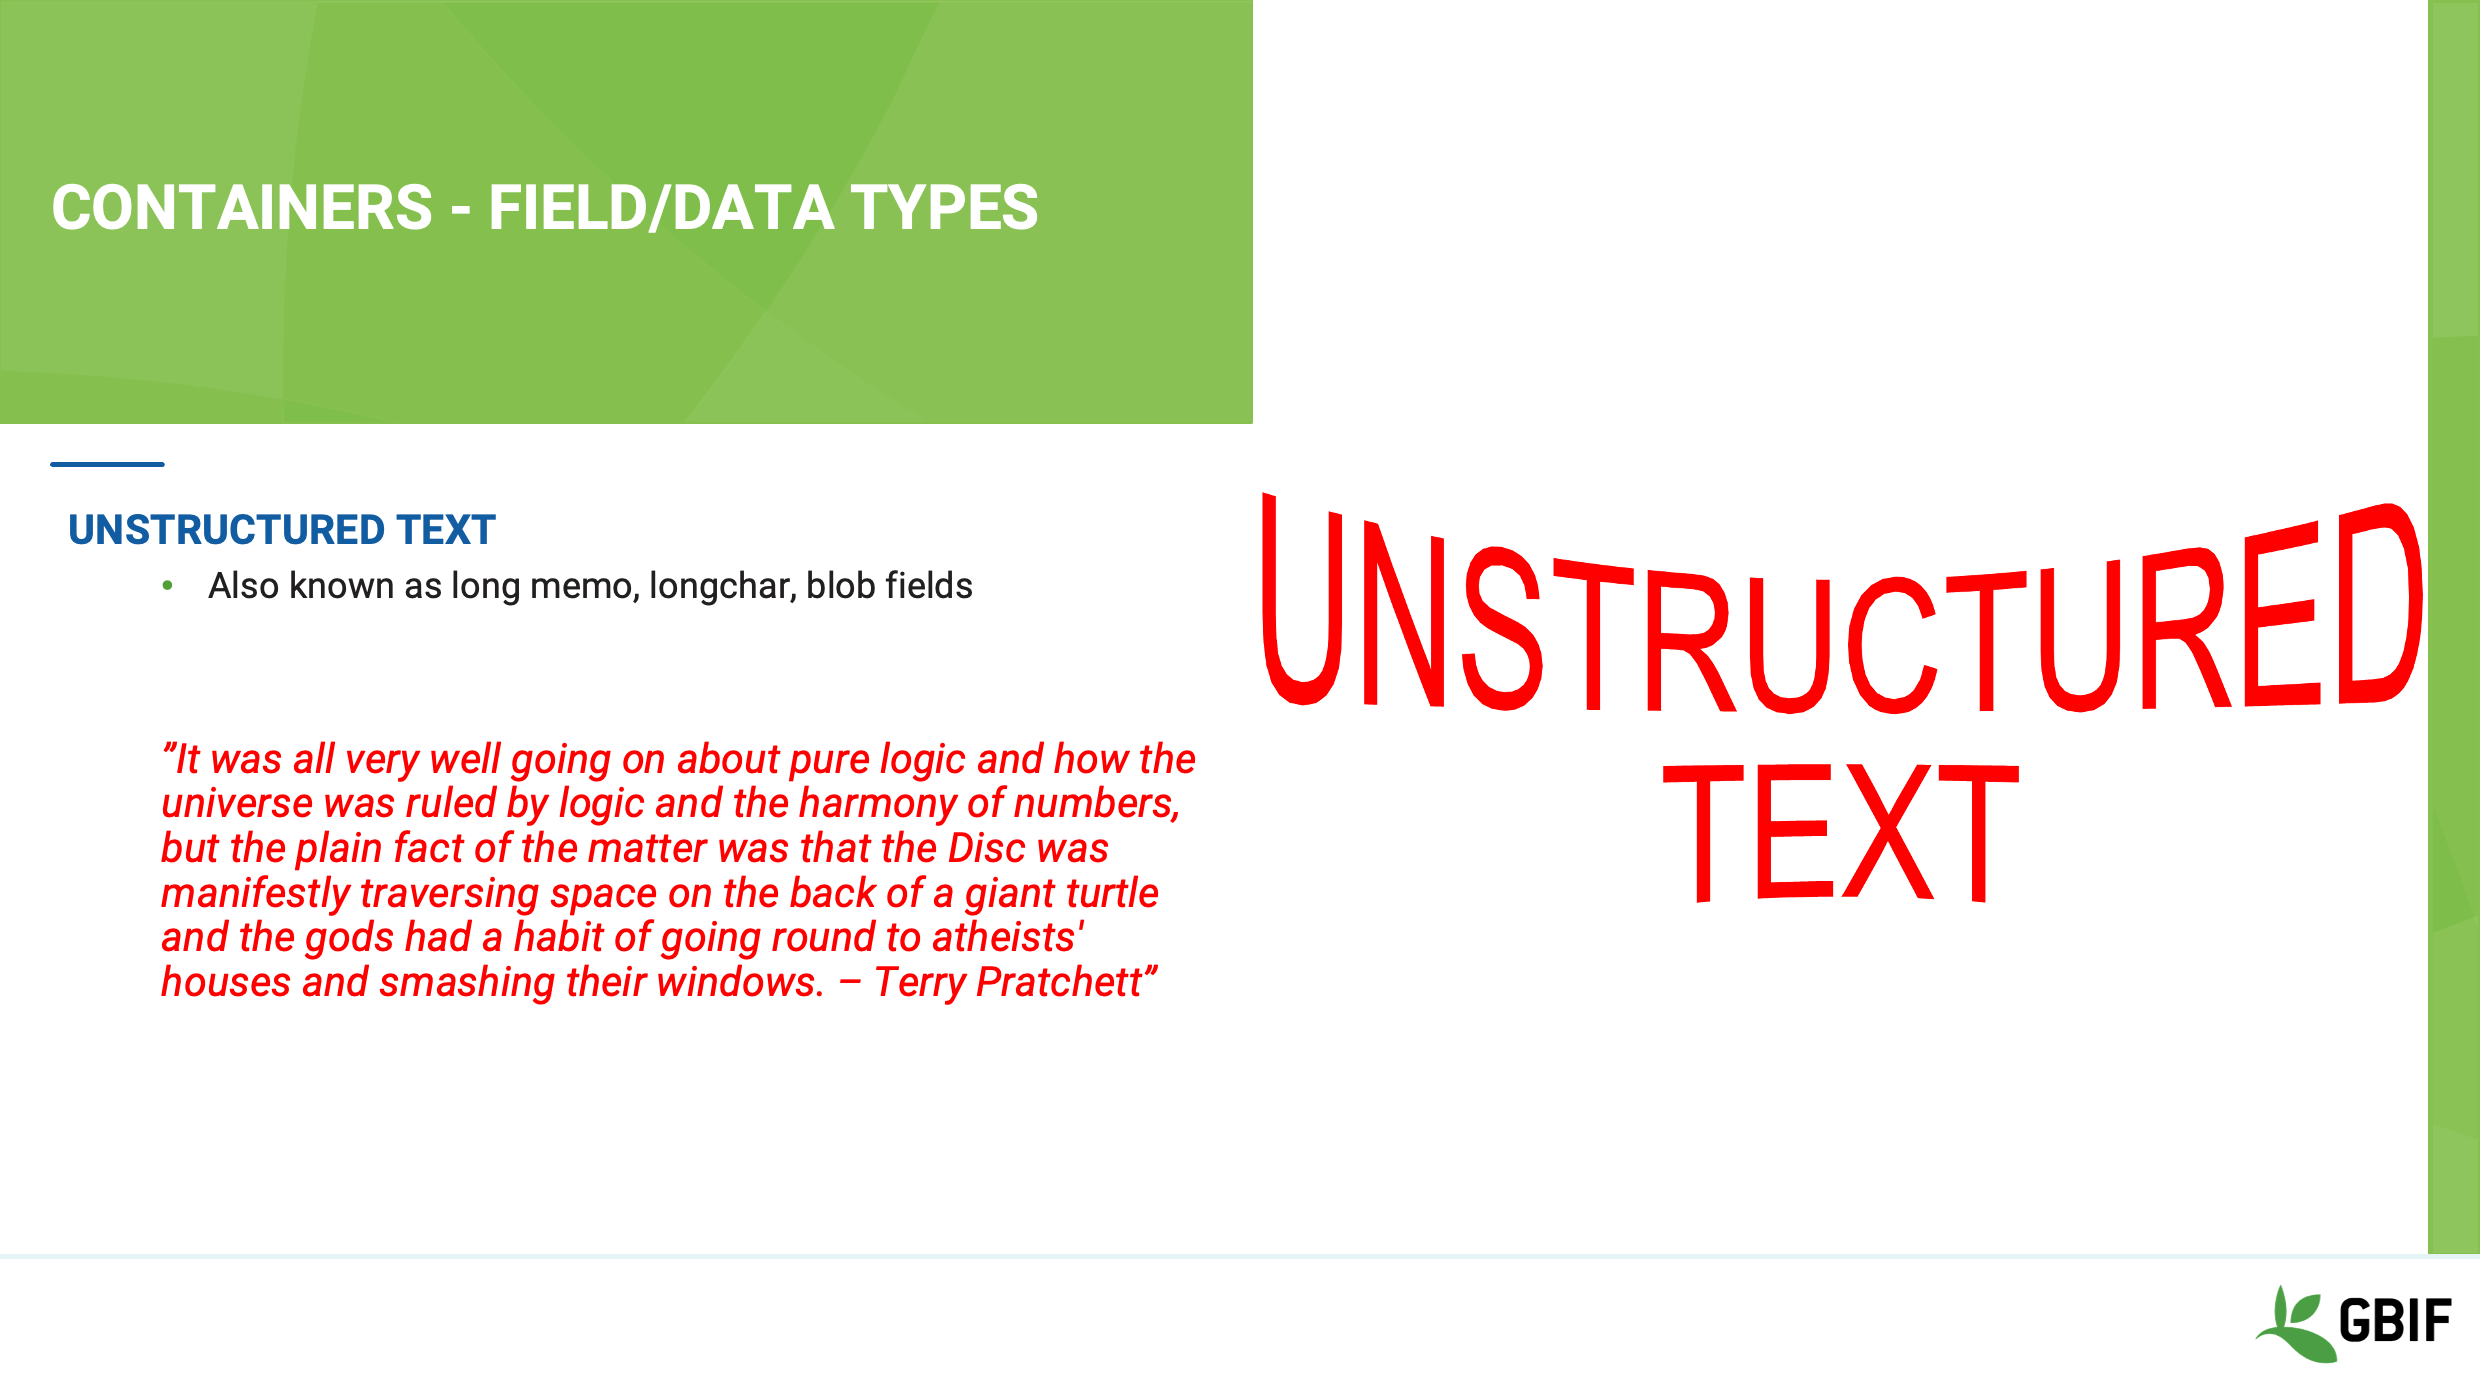
Another type of text field that you will come across is the Unstructured text field, also known as memo, long char or blob fields.
These types of field are used to hold large amounts of unformatted text and unlike alphanumeric fields may not have an obvious character limit.
In simple systems, they are generally less flexible in terms of processing; for example sorting and indexing, than their smaller alphanumeric cousins.
With decreased storage costs and the rise of NoSQL document-oriented database programs, such as MongoDB however, this is changing.
Slide 9 - Containers – field/data types
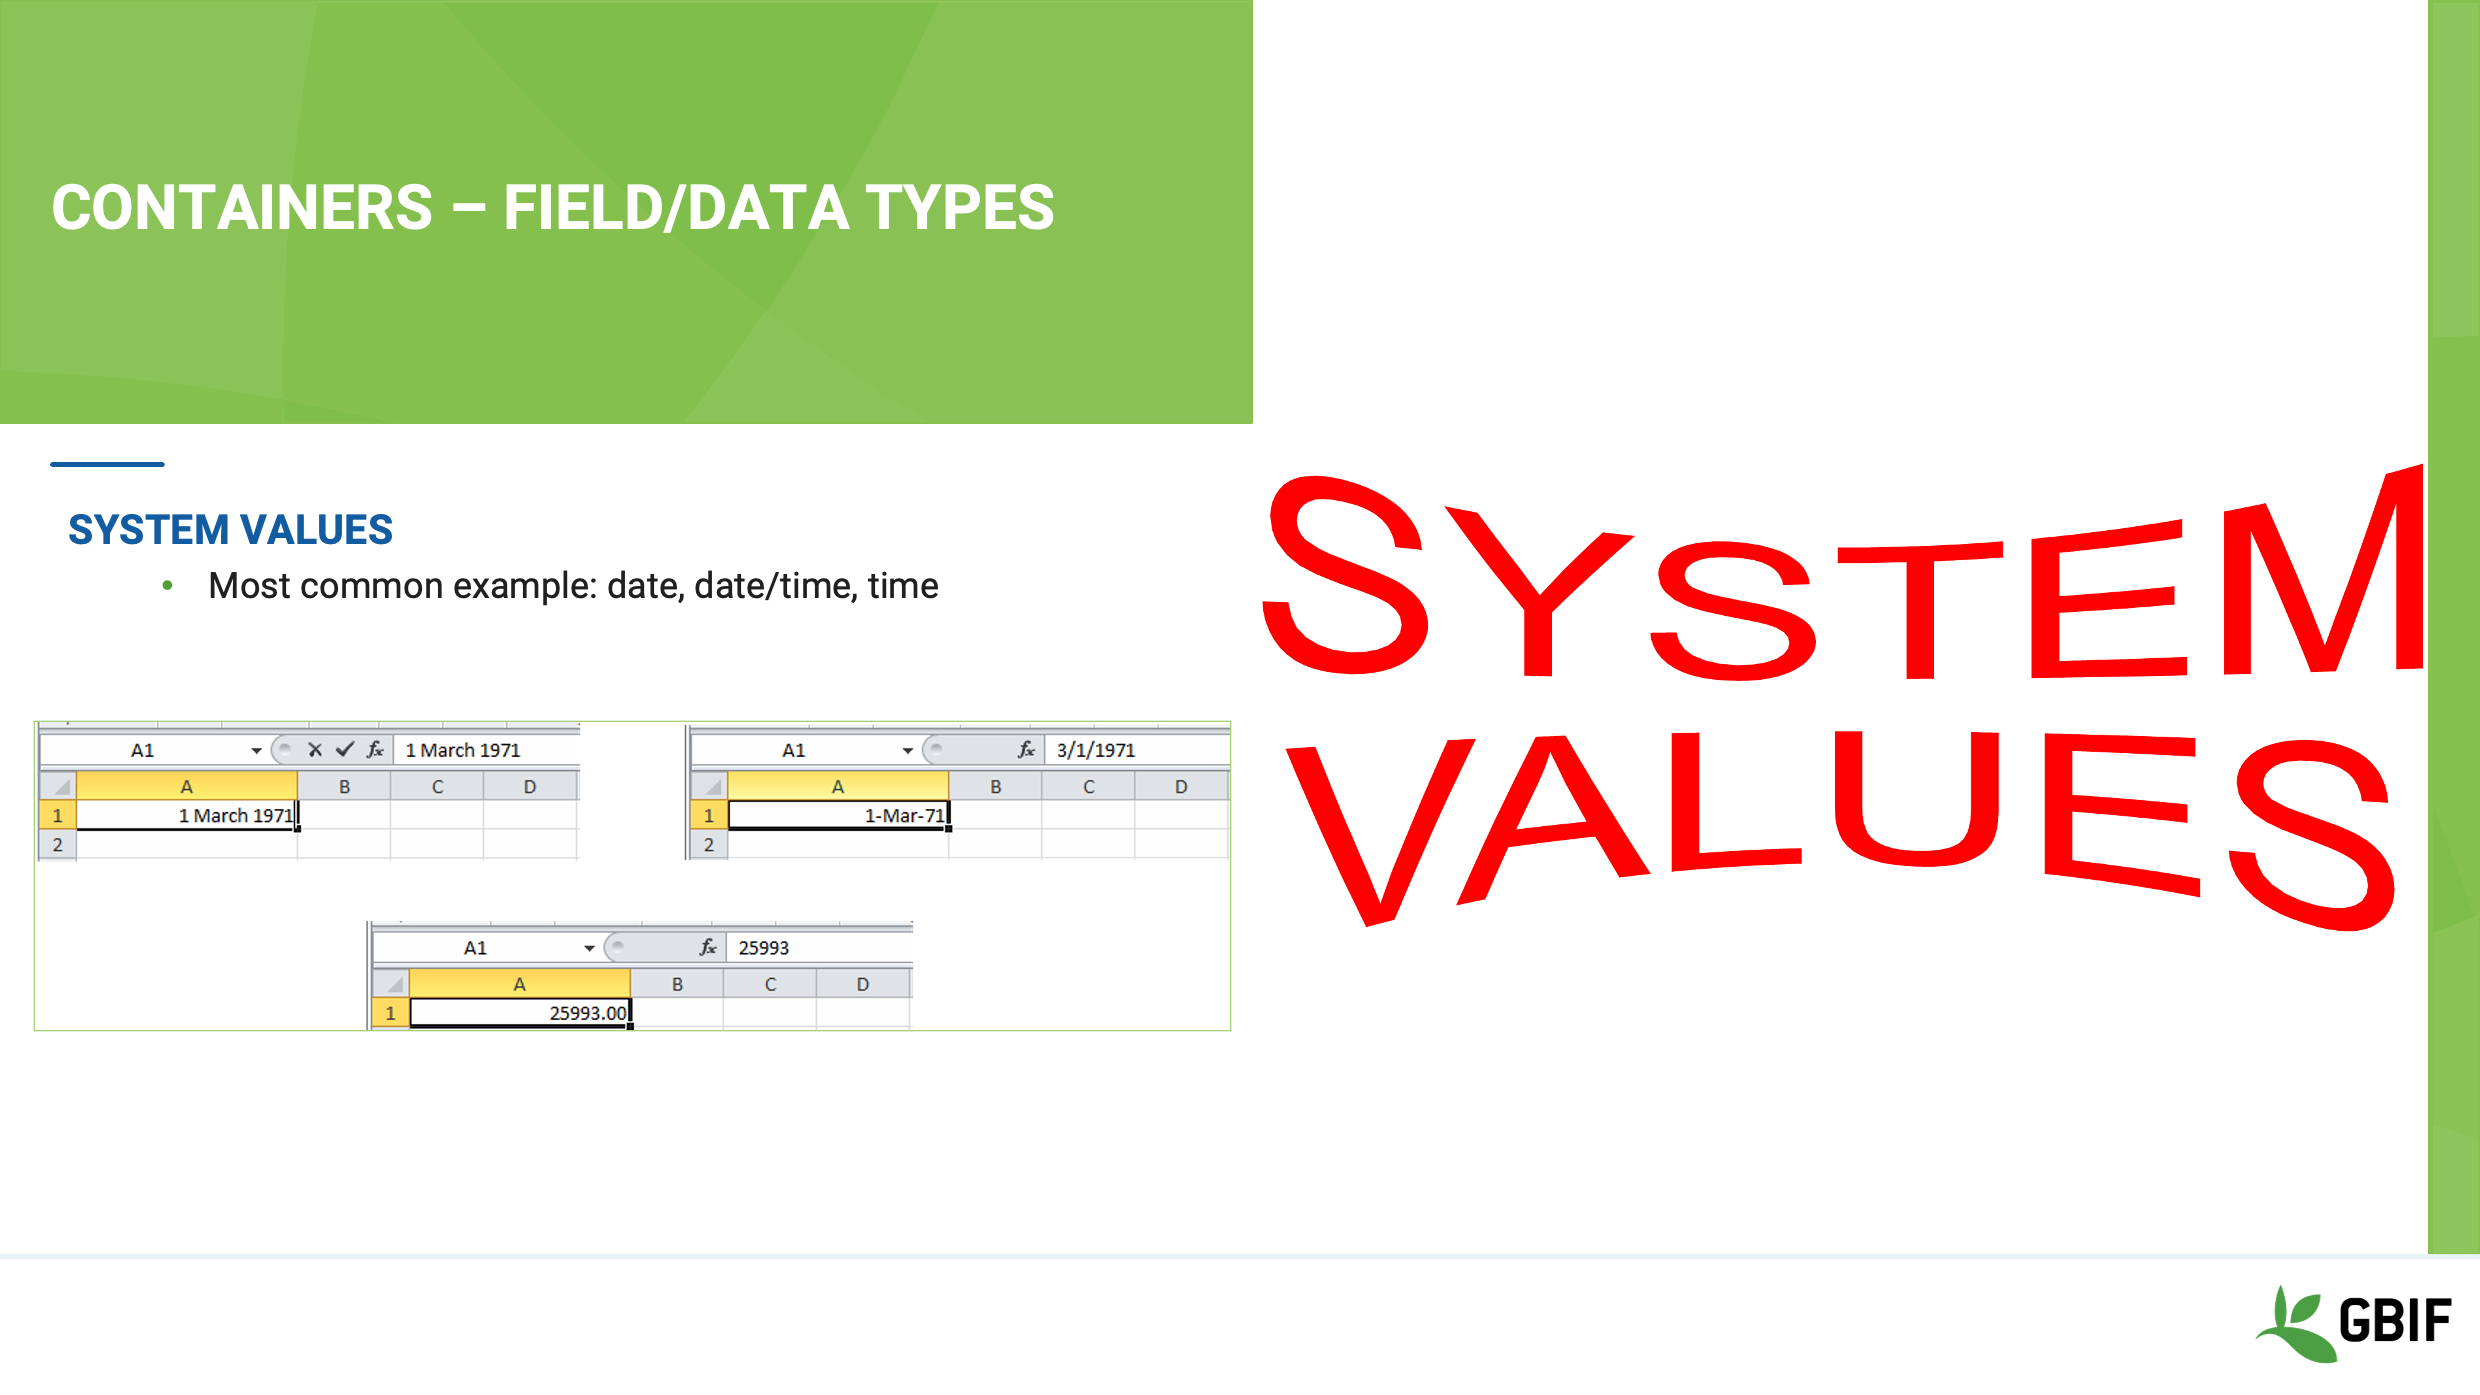
System Value fields have a double nature and what you see on the screen is not usually the actual value that the software is storing in memory. Date and time fields are the most common example of this type of field.
In this example you typed “1 March 1971” into a cell in Excel and hit return.
Now it says “1-Mar-71” in the cell AND “3/1/1971” in the functionbar.
Excel is applying a display format to the cell, which you can change at will.
HOWEVER, if you remove the format you see that what is actually being stored in the field is the number 25993.00!
So you can see that the field is actually a float. You should beware because that system value not be the same from software to software. Exports should to checked to make sure the actual date is exported and not the system value.
Slide 10 - Containers – field/data types
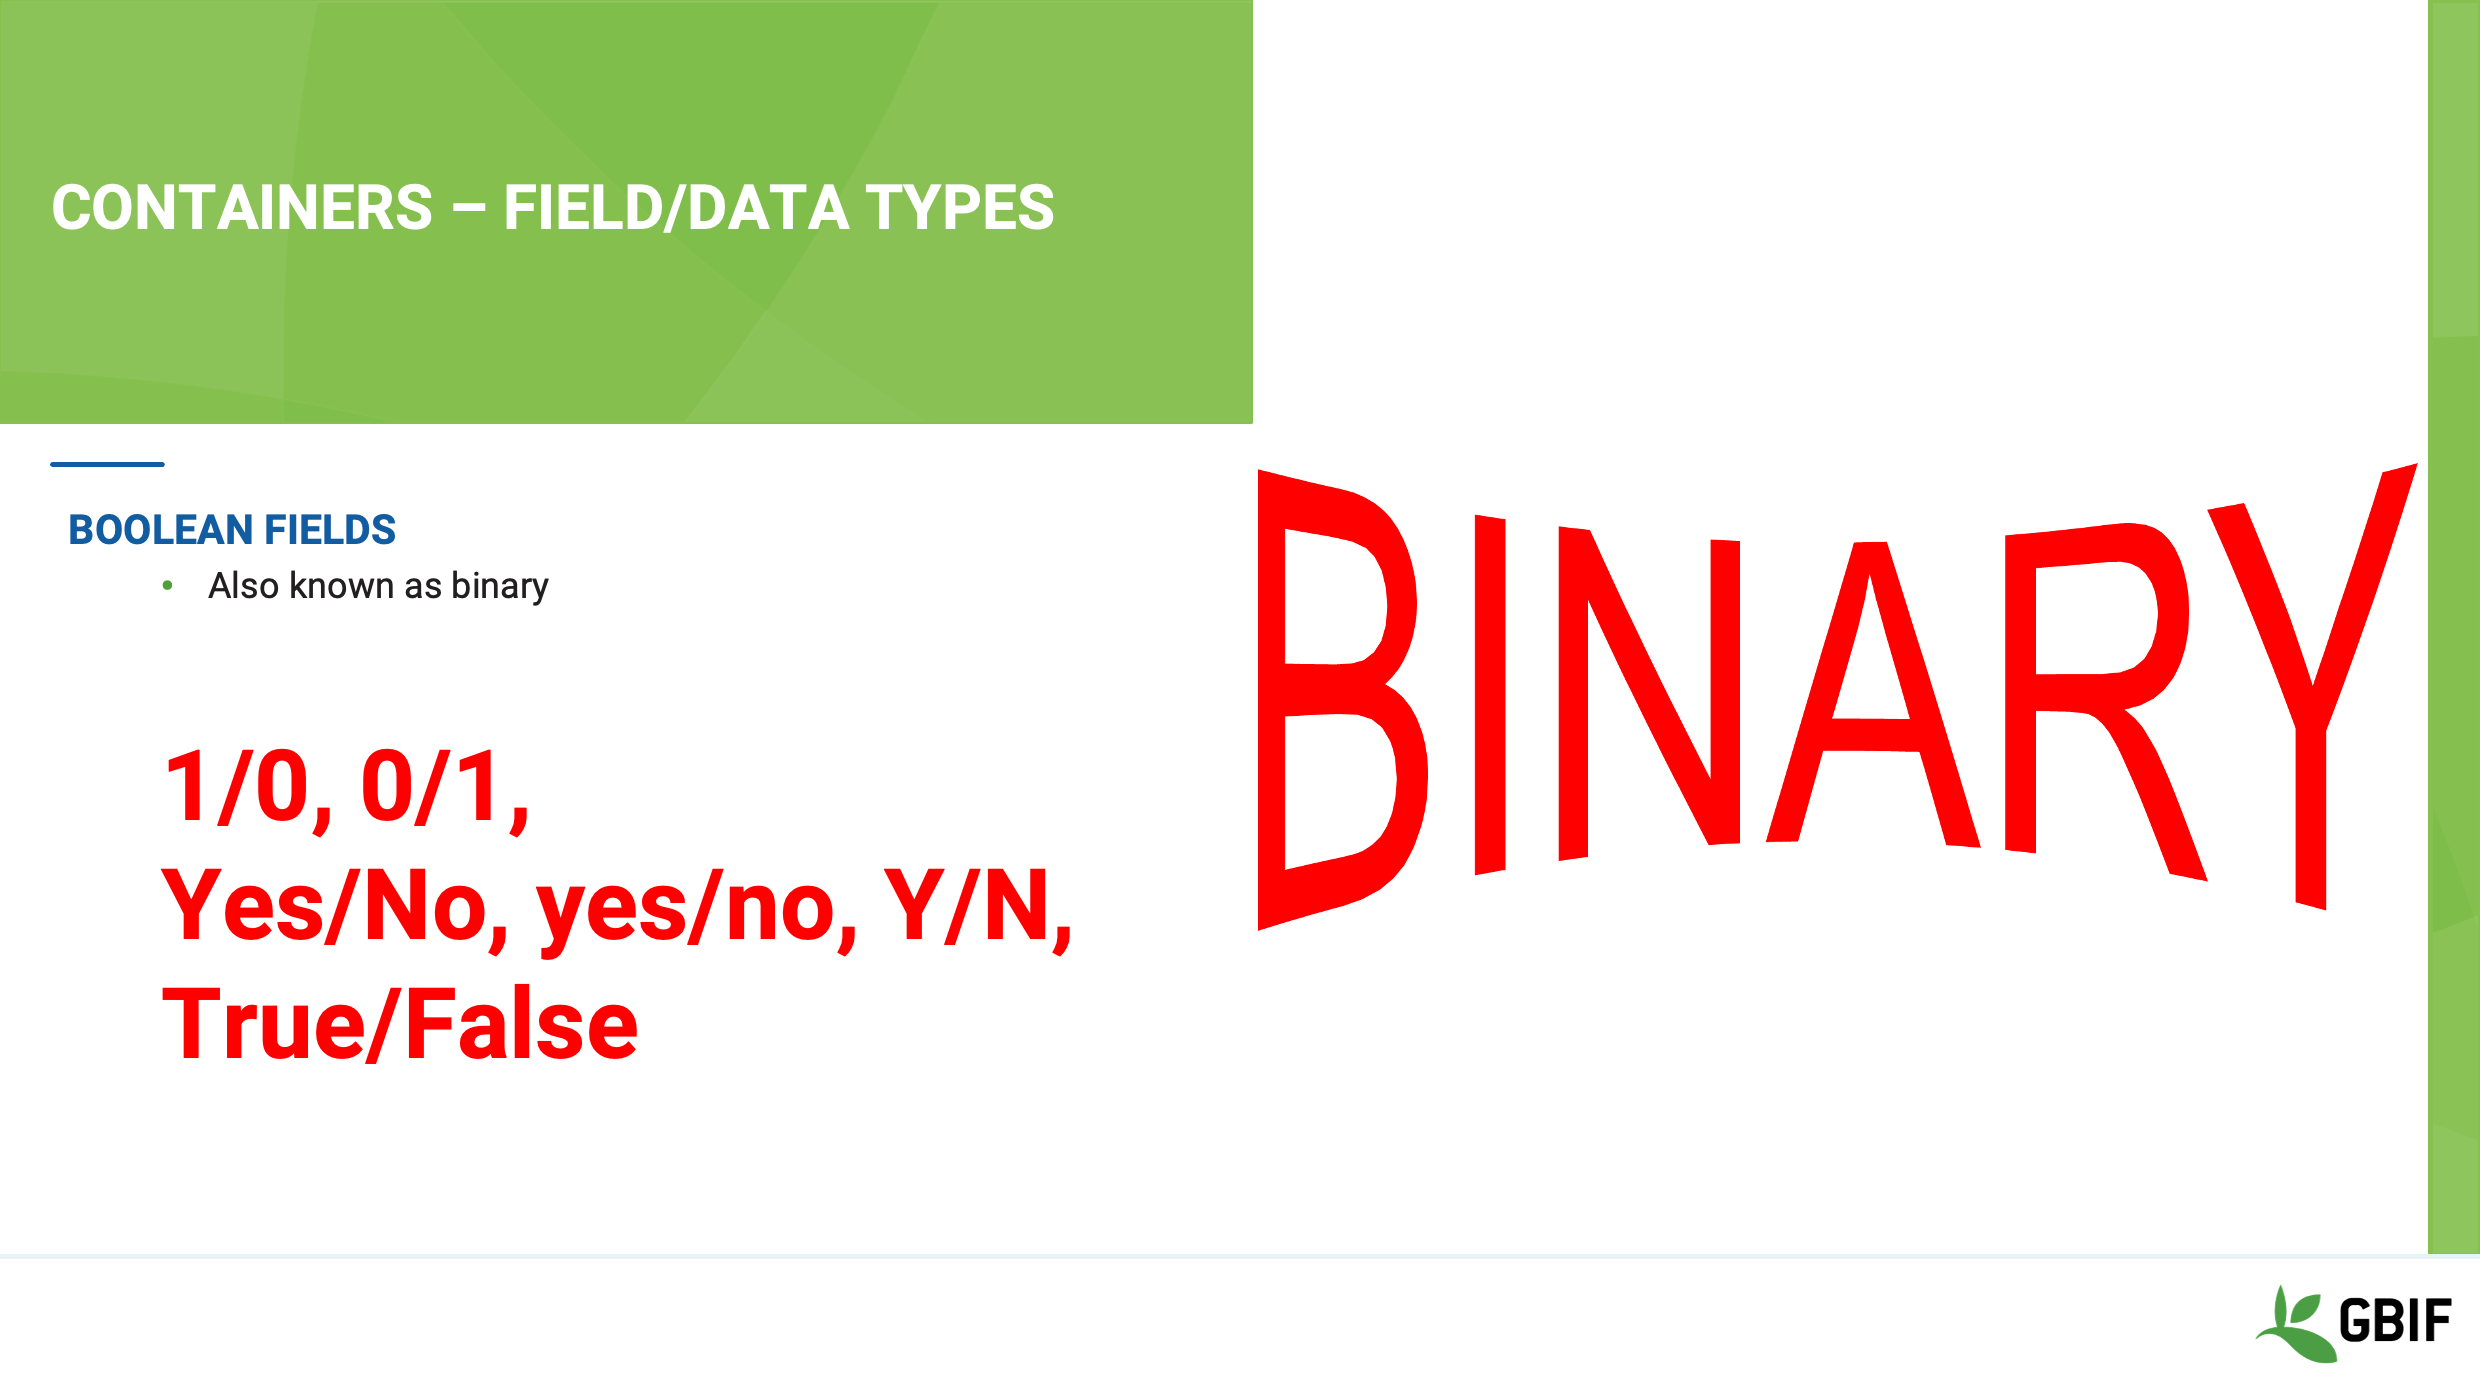
Boolean fields – also known as Binary fields only contain one of two values that represent a one or a zero.
They are a special case of a System Value field as mentioned previously in that whilst the software actually saves a number it often displays values such as:
Yes/No; Yes/no; Y/N; True/False.
You should take care to find out which way around the system you are using translates.
Is a 1 a yes or no?
Slide 11 - Containers – field/data types
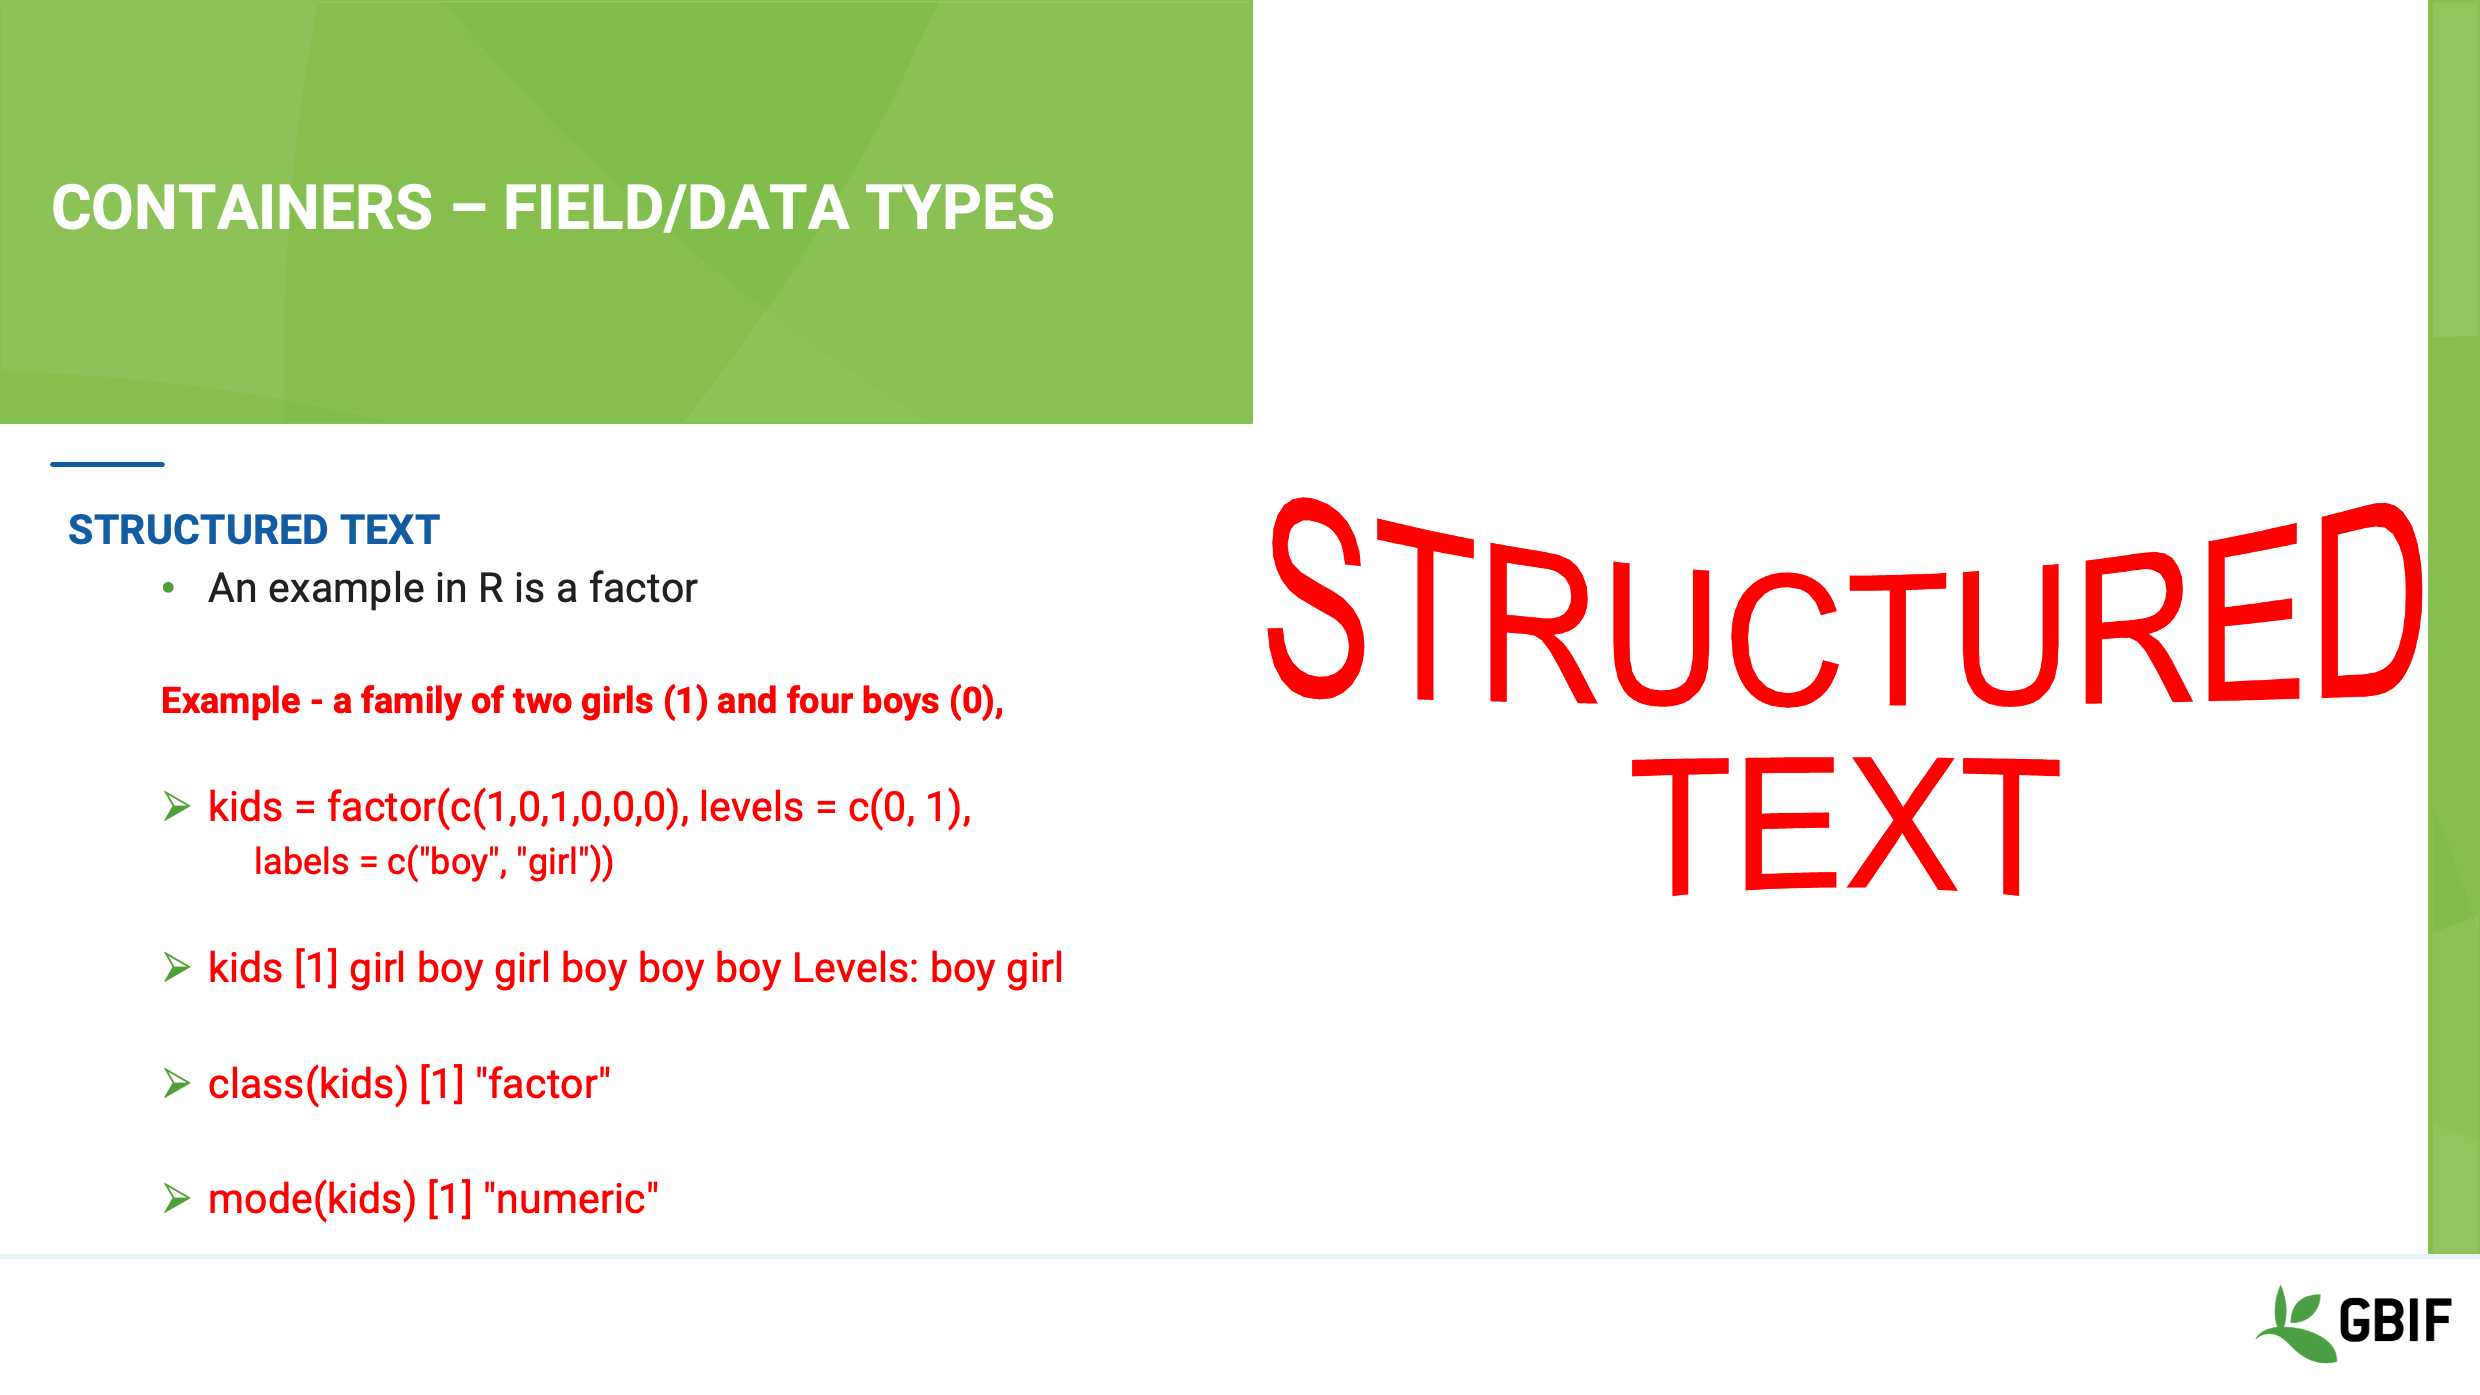
Structured Text fields are less common but mentioned here for completeness.
They are fields which can be either made up of combinations of the simple data types or even be defined by the data itself.
Most often these are used in programming languages to allow flexibility and handling of complex concepts.
An example is the factor field used in the R programming language, which is defined as a type vector containing a set of numeric codes with character-valued levels.
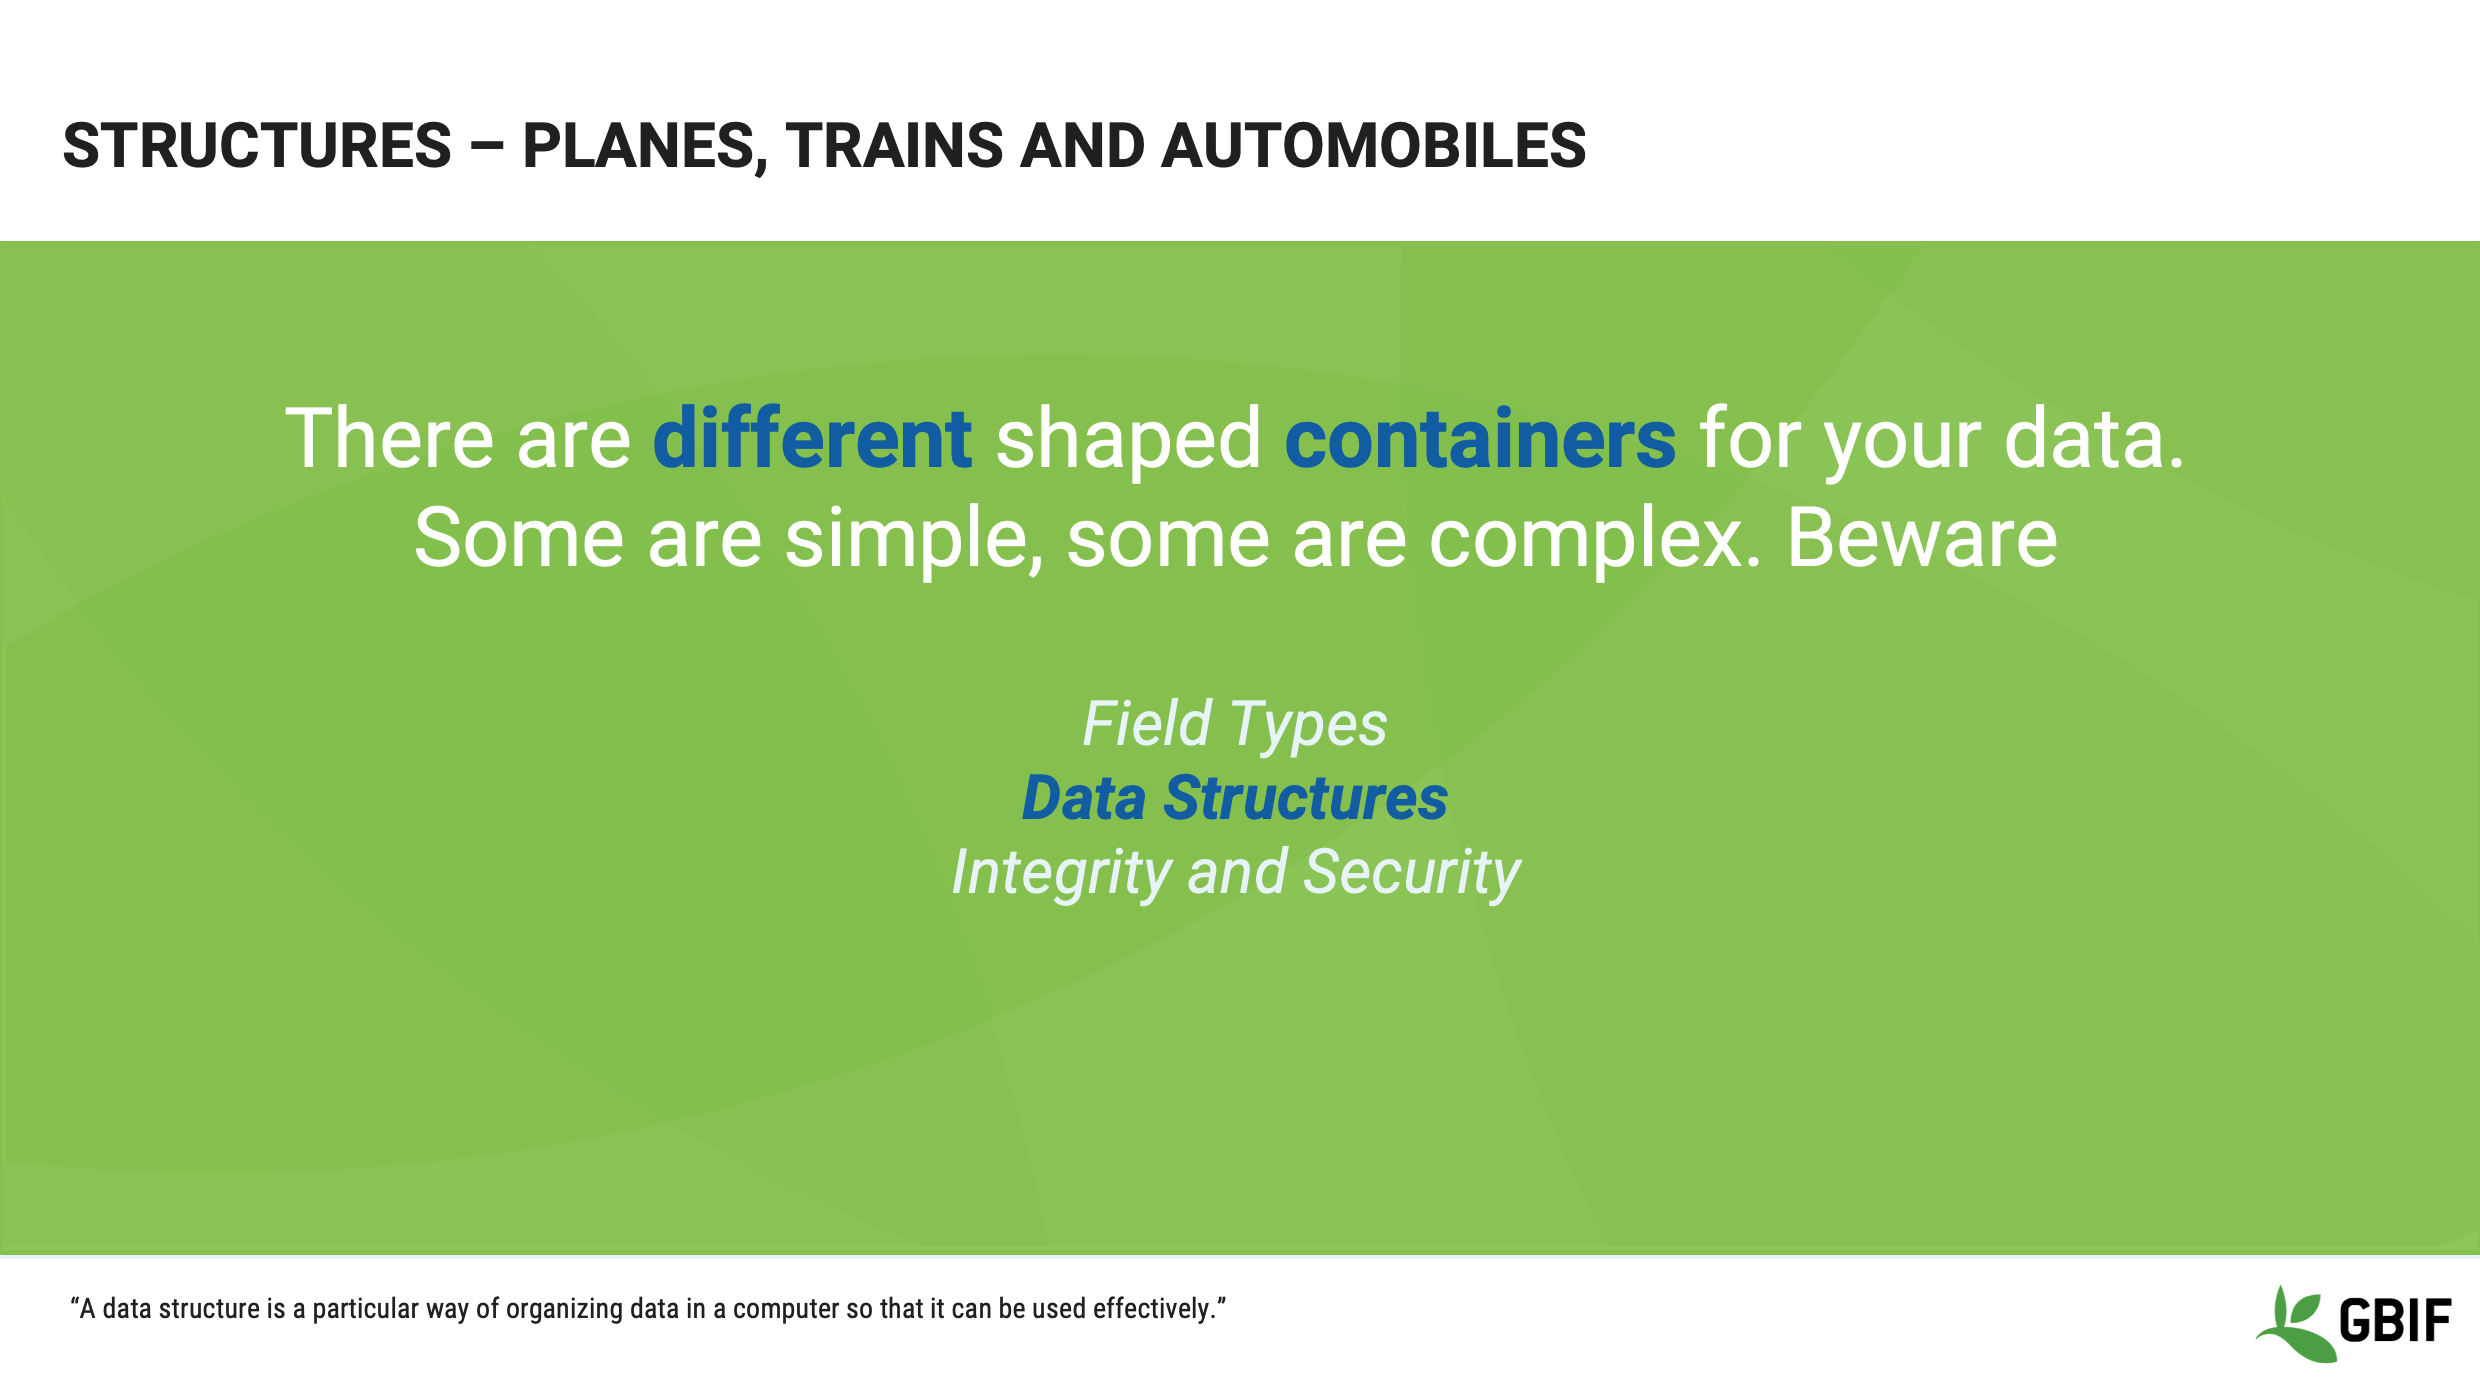
Slide 12 - Structures - planes, trains and automobiles
Now that you have an understanding of the field types used to represent your data elements let’s talk about the containers or structures, that many database programs and software use collate and display your data.
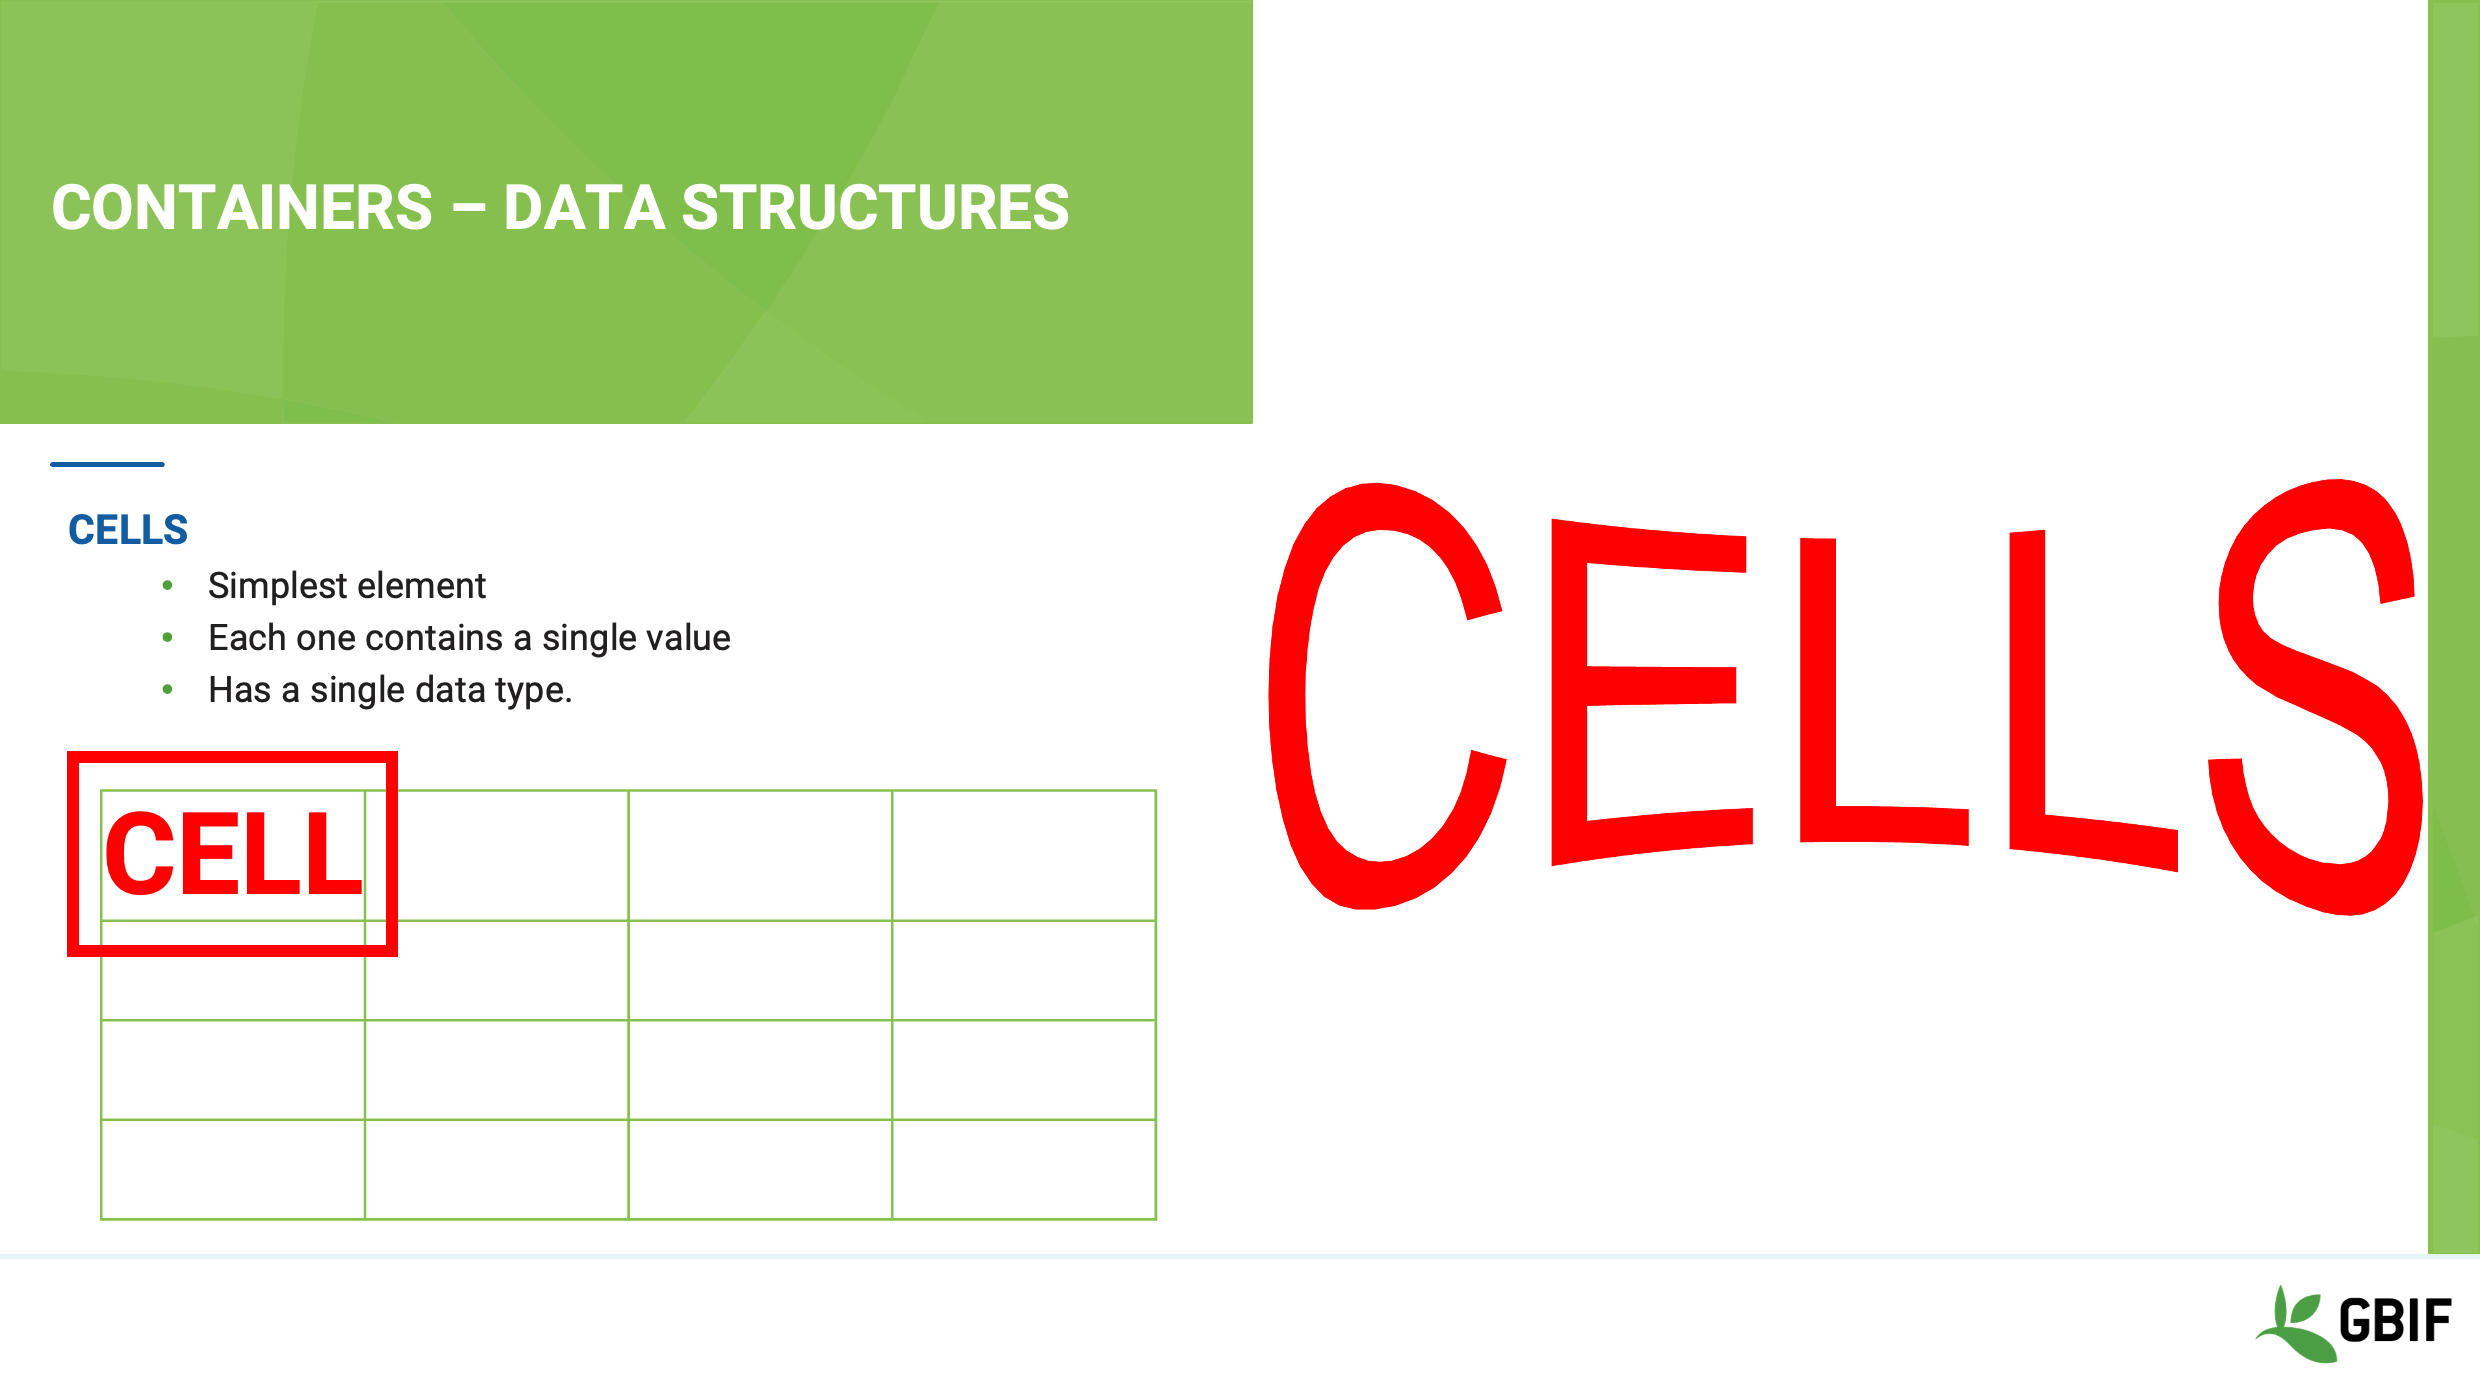
Slide 13 - Containers - Data structures
First is the cell.
This is the smallest data structure, it holds a single value and has a single data type associated with it.
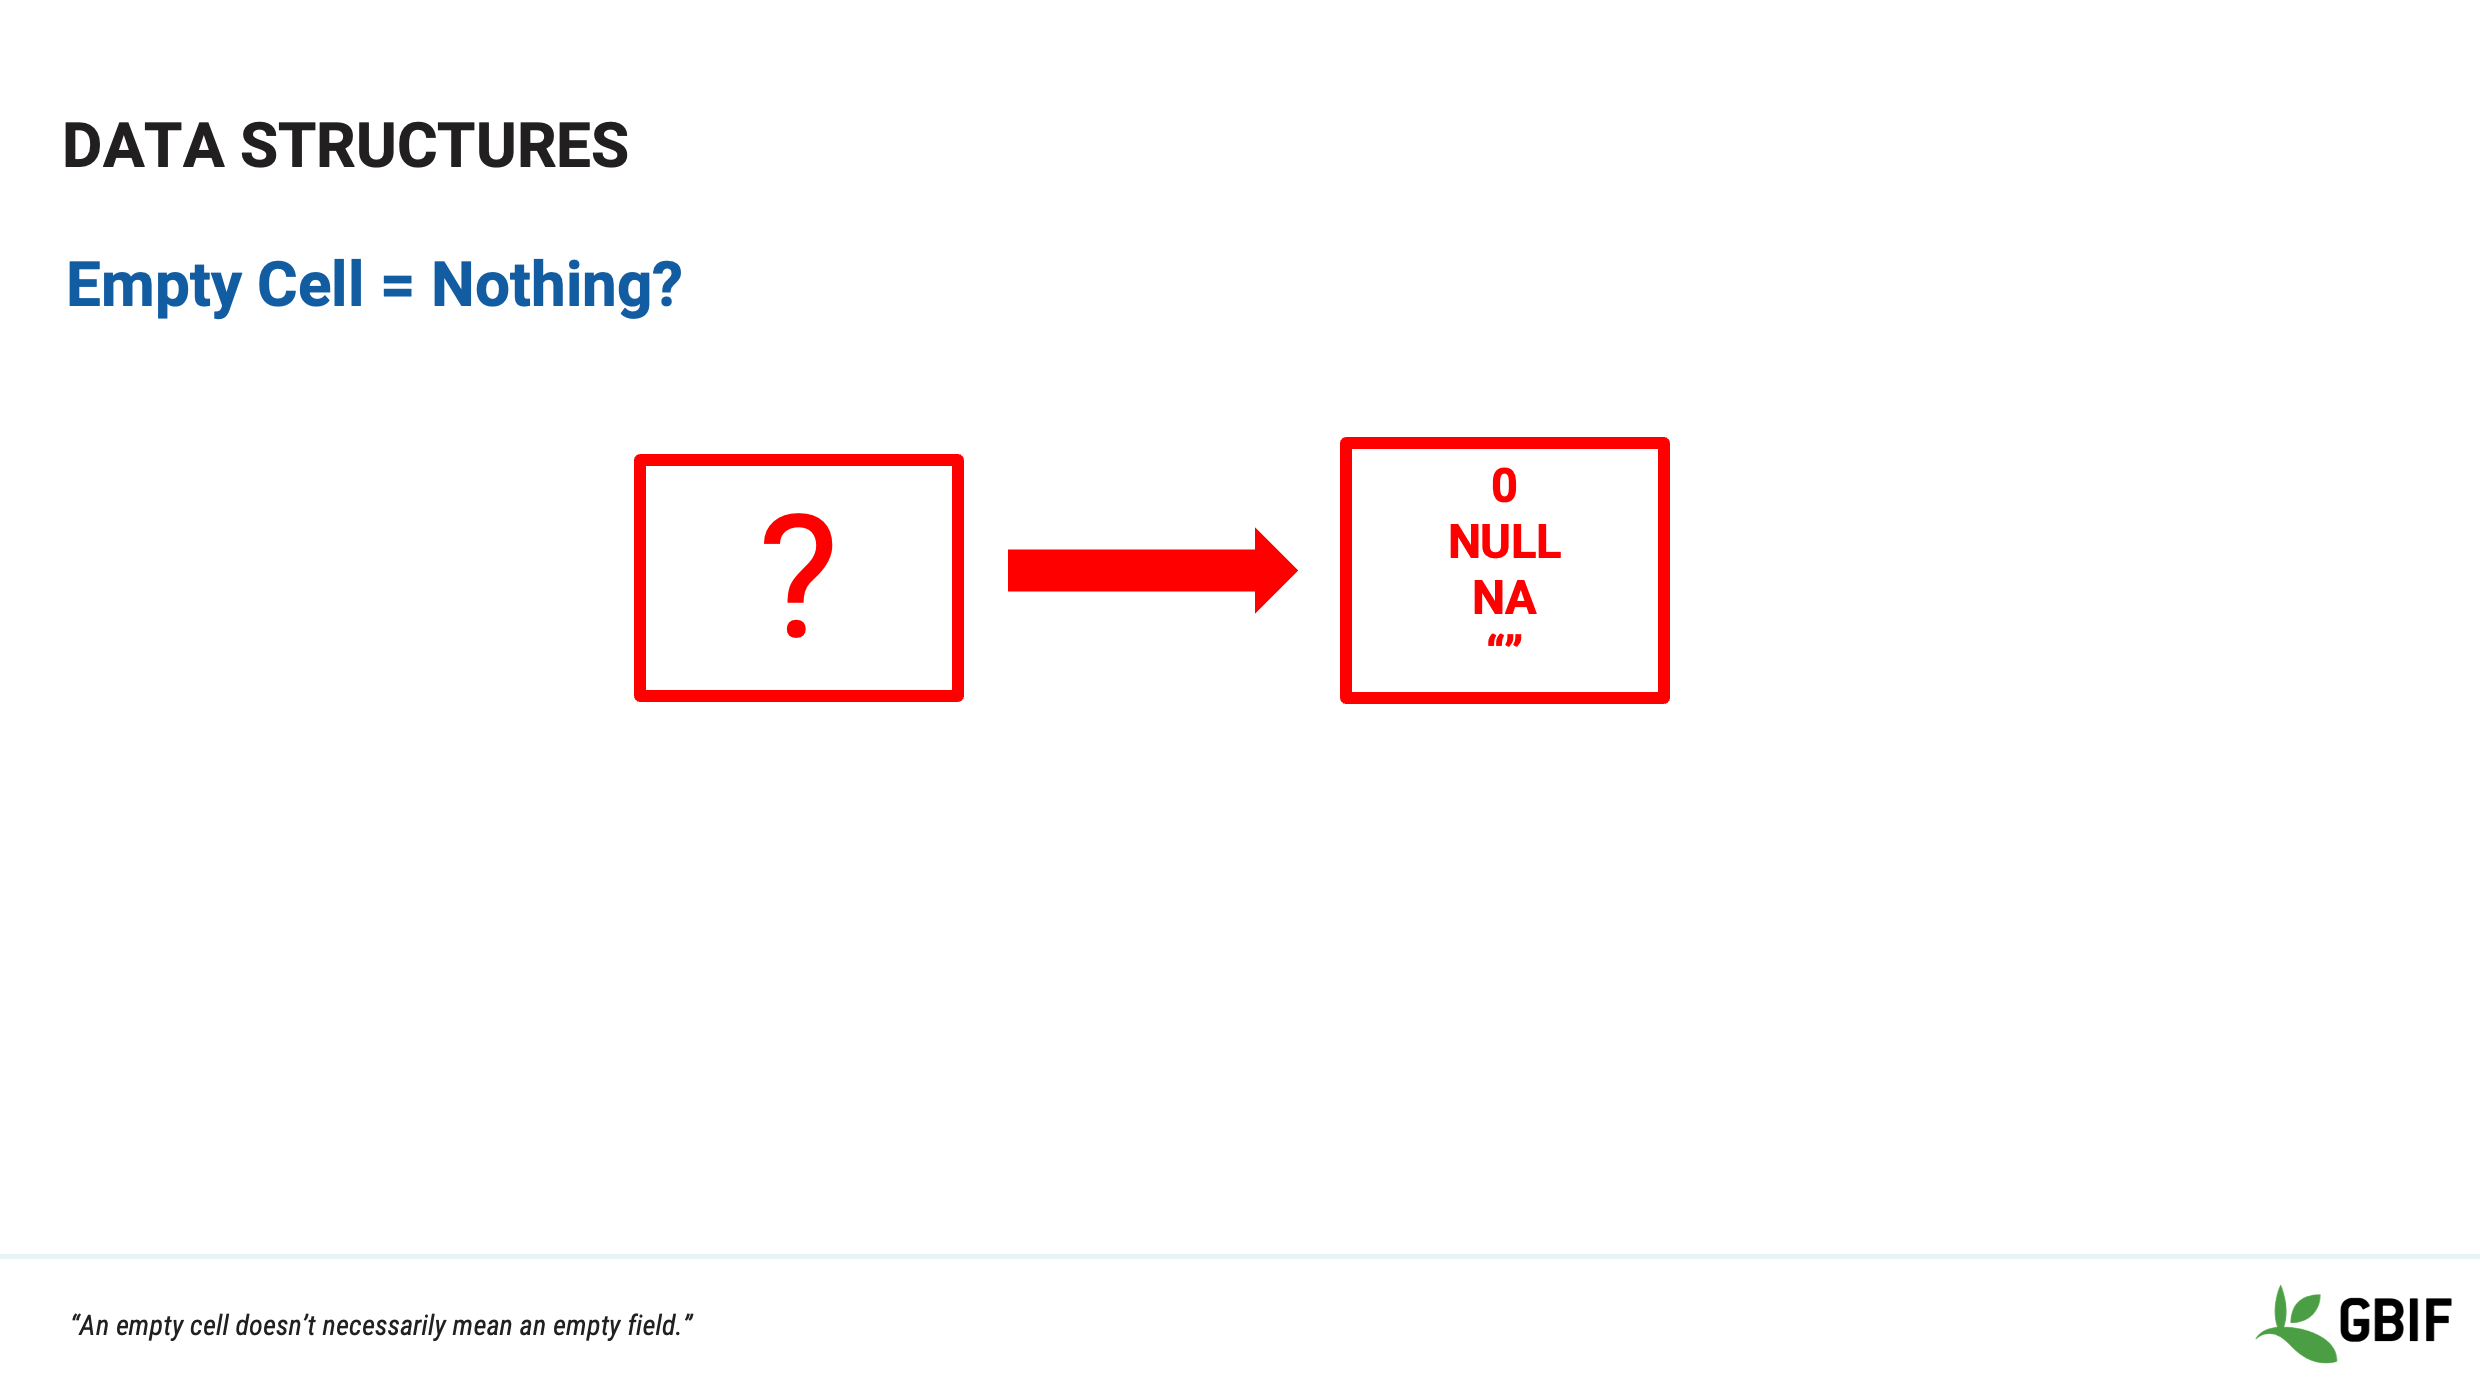
Slide 14 - Data structures
There is one concept that you should beware of when it comes to cells and that is the “empty cell”.
“An empty cell doesn’t necessarily mean an empty field.”
Some software “fills” an empty field with a System value based on the data type.
Examples are “NULL” “N A” or even zero!
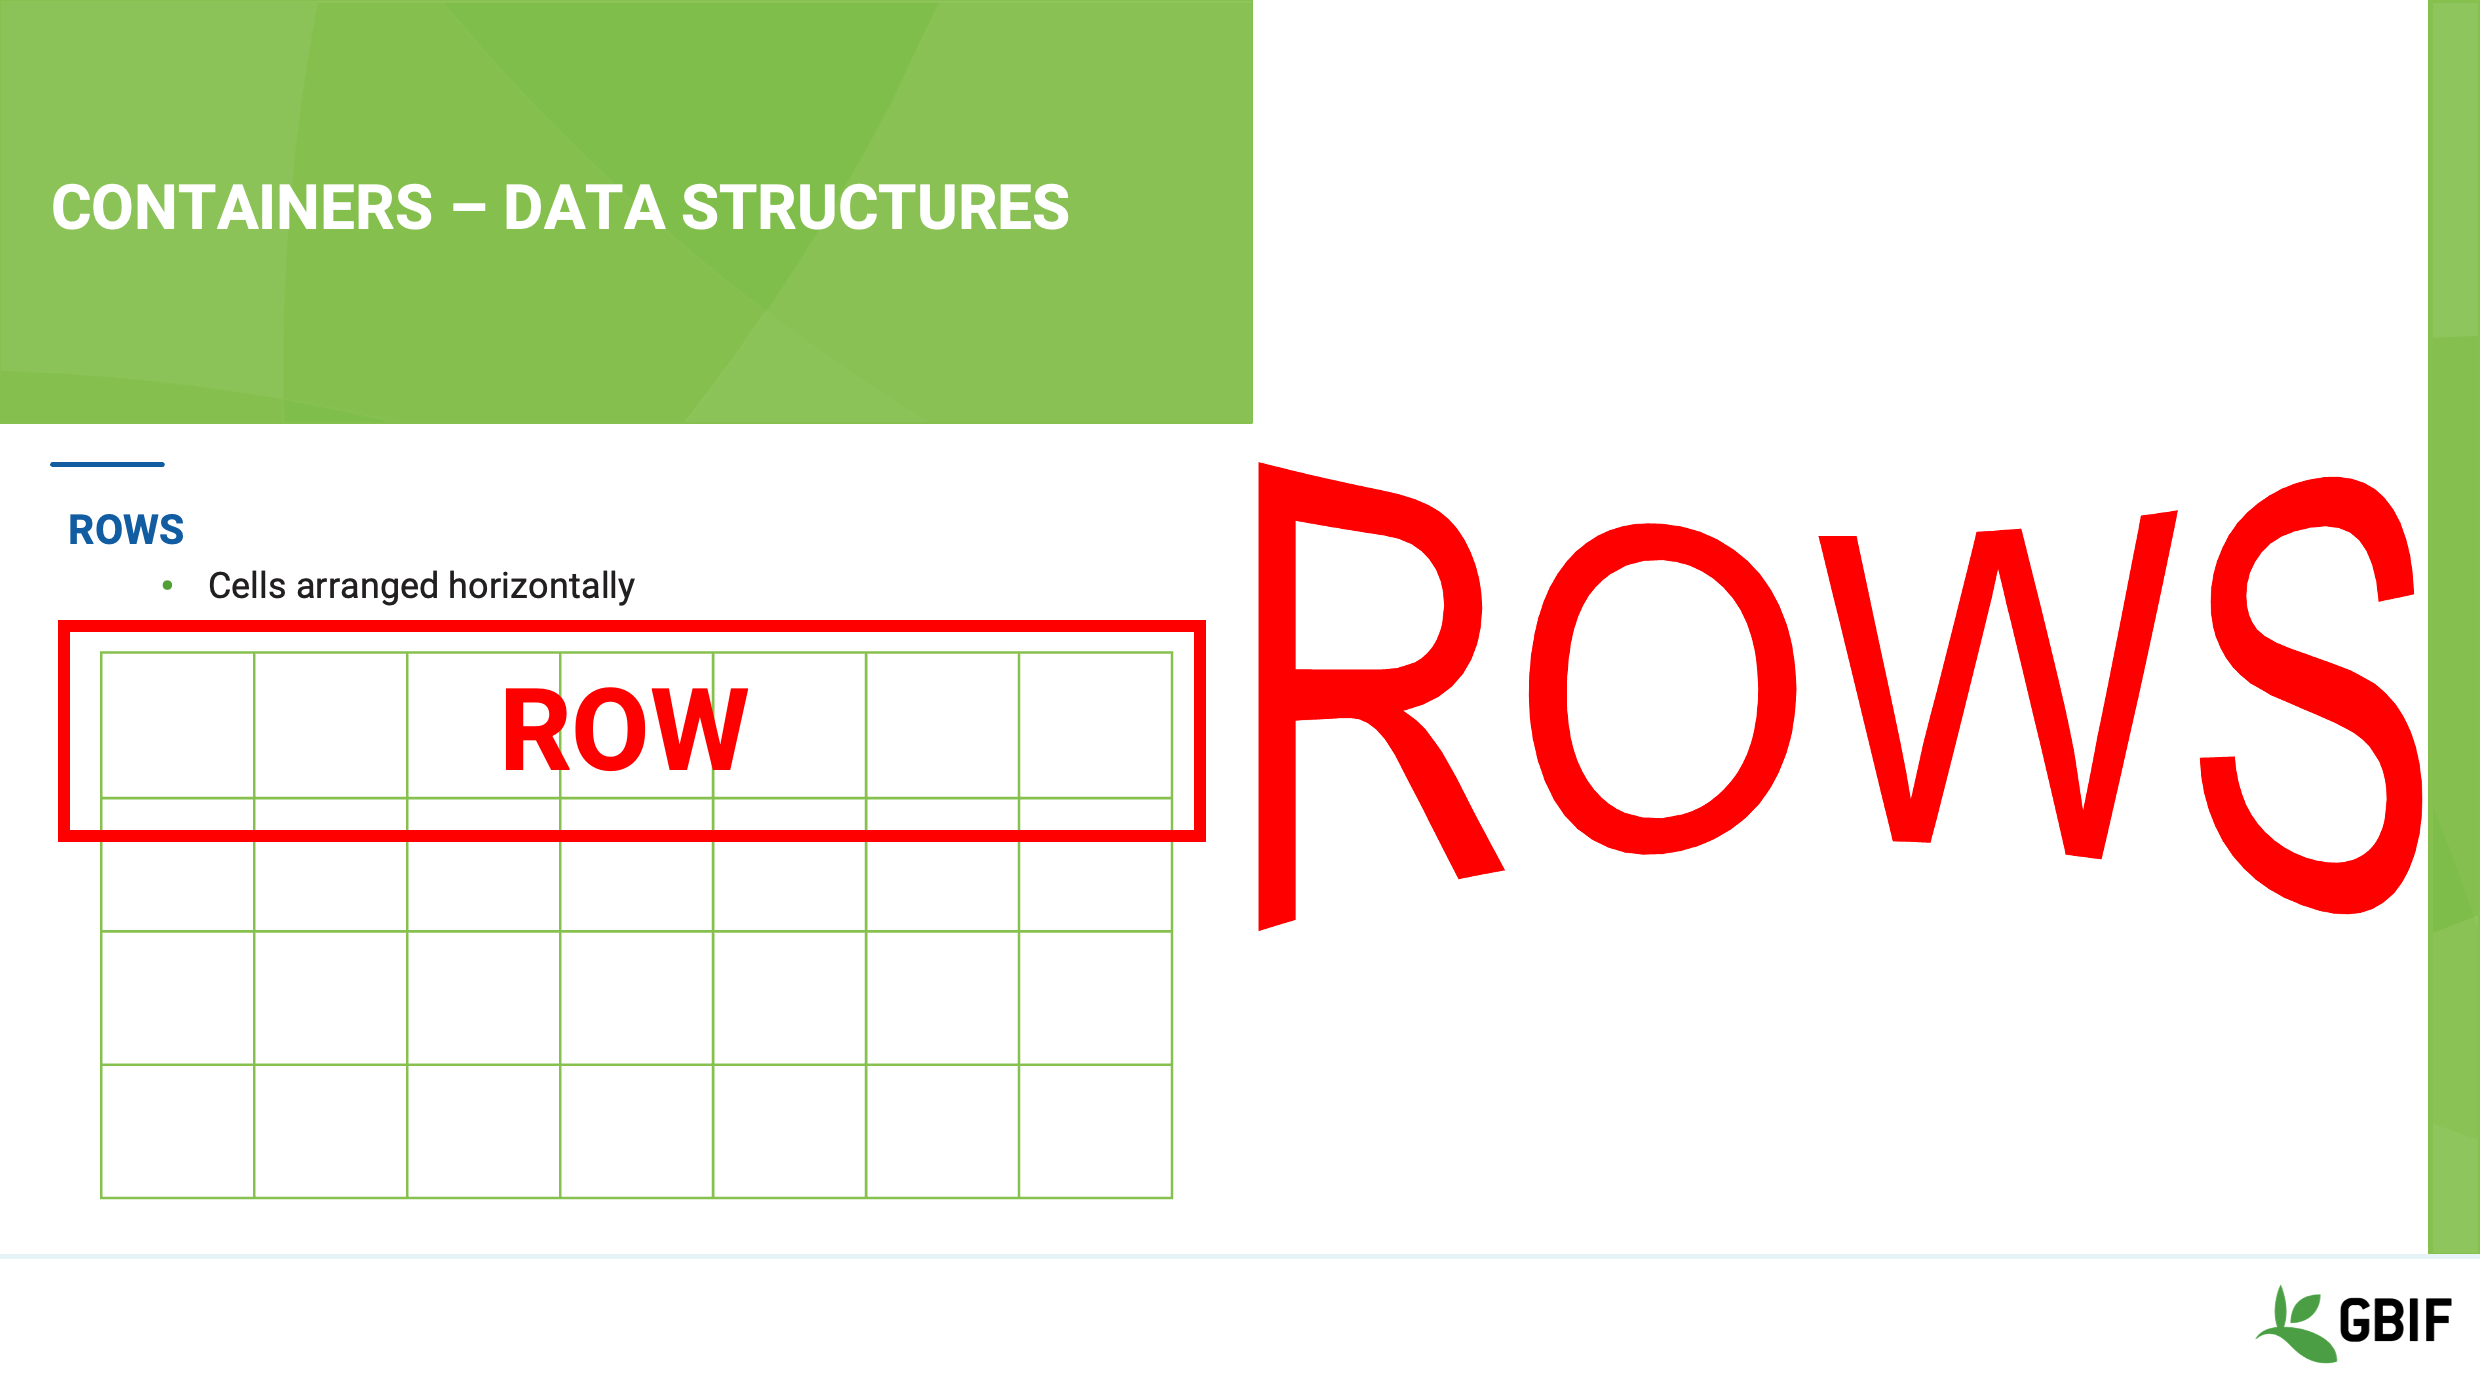
Slide 15 - Containers - Data structures
As you start to organize cells you begin to build a grid. Grids have implied structure in the form of
Rows
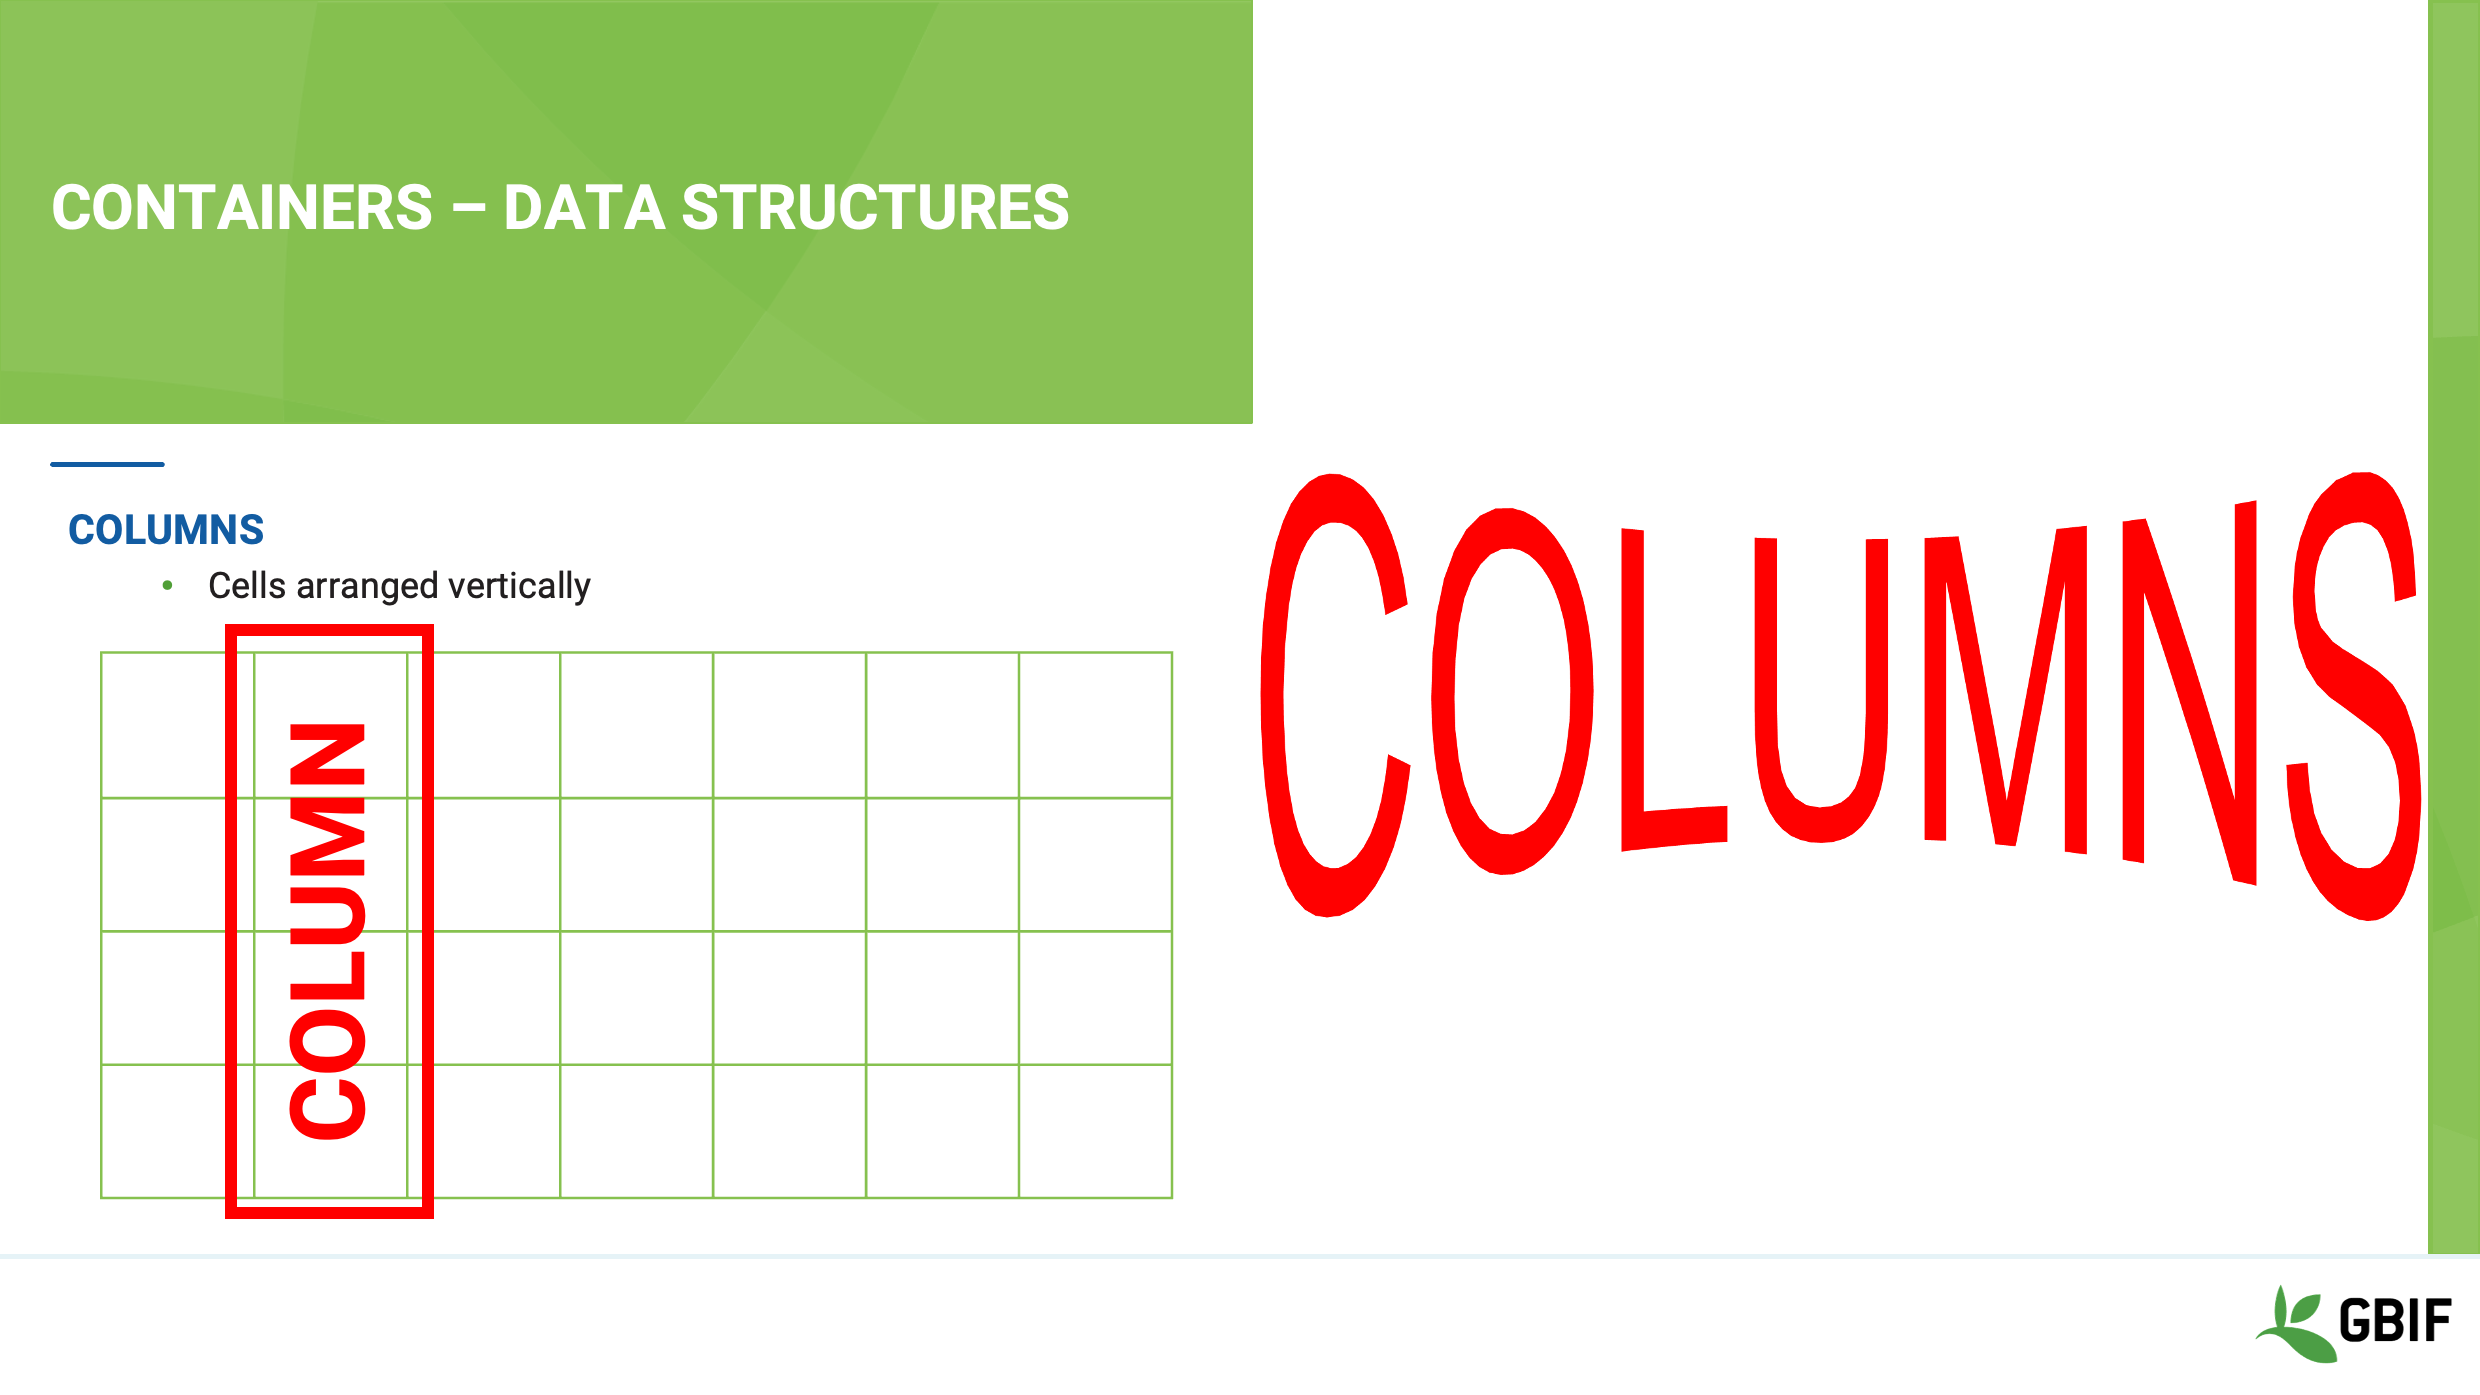
Slide 16 - Containers - Data structures
And columns.
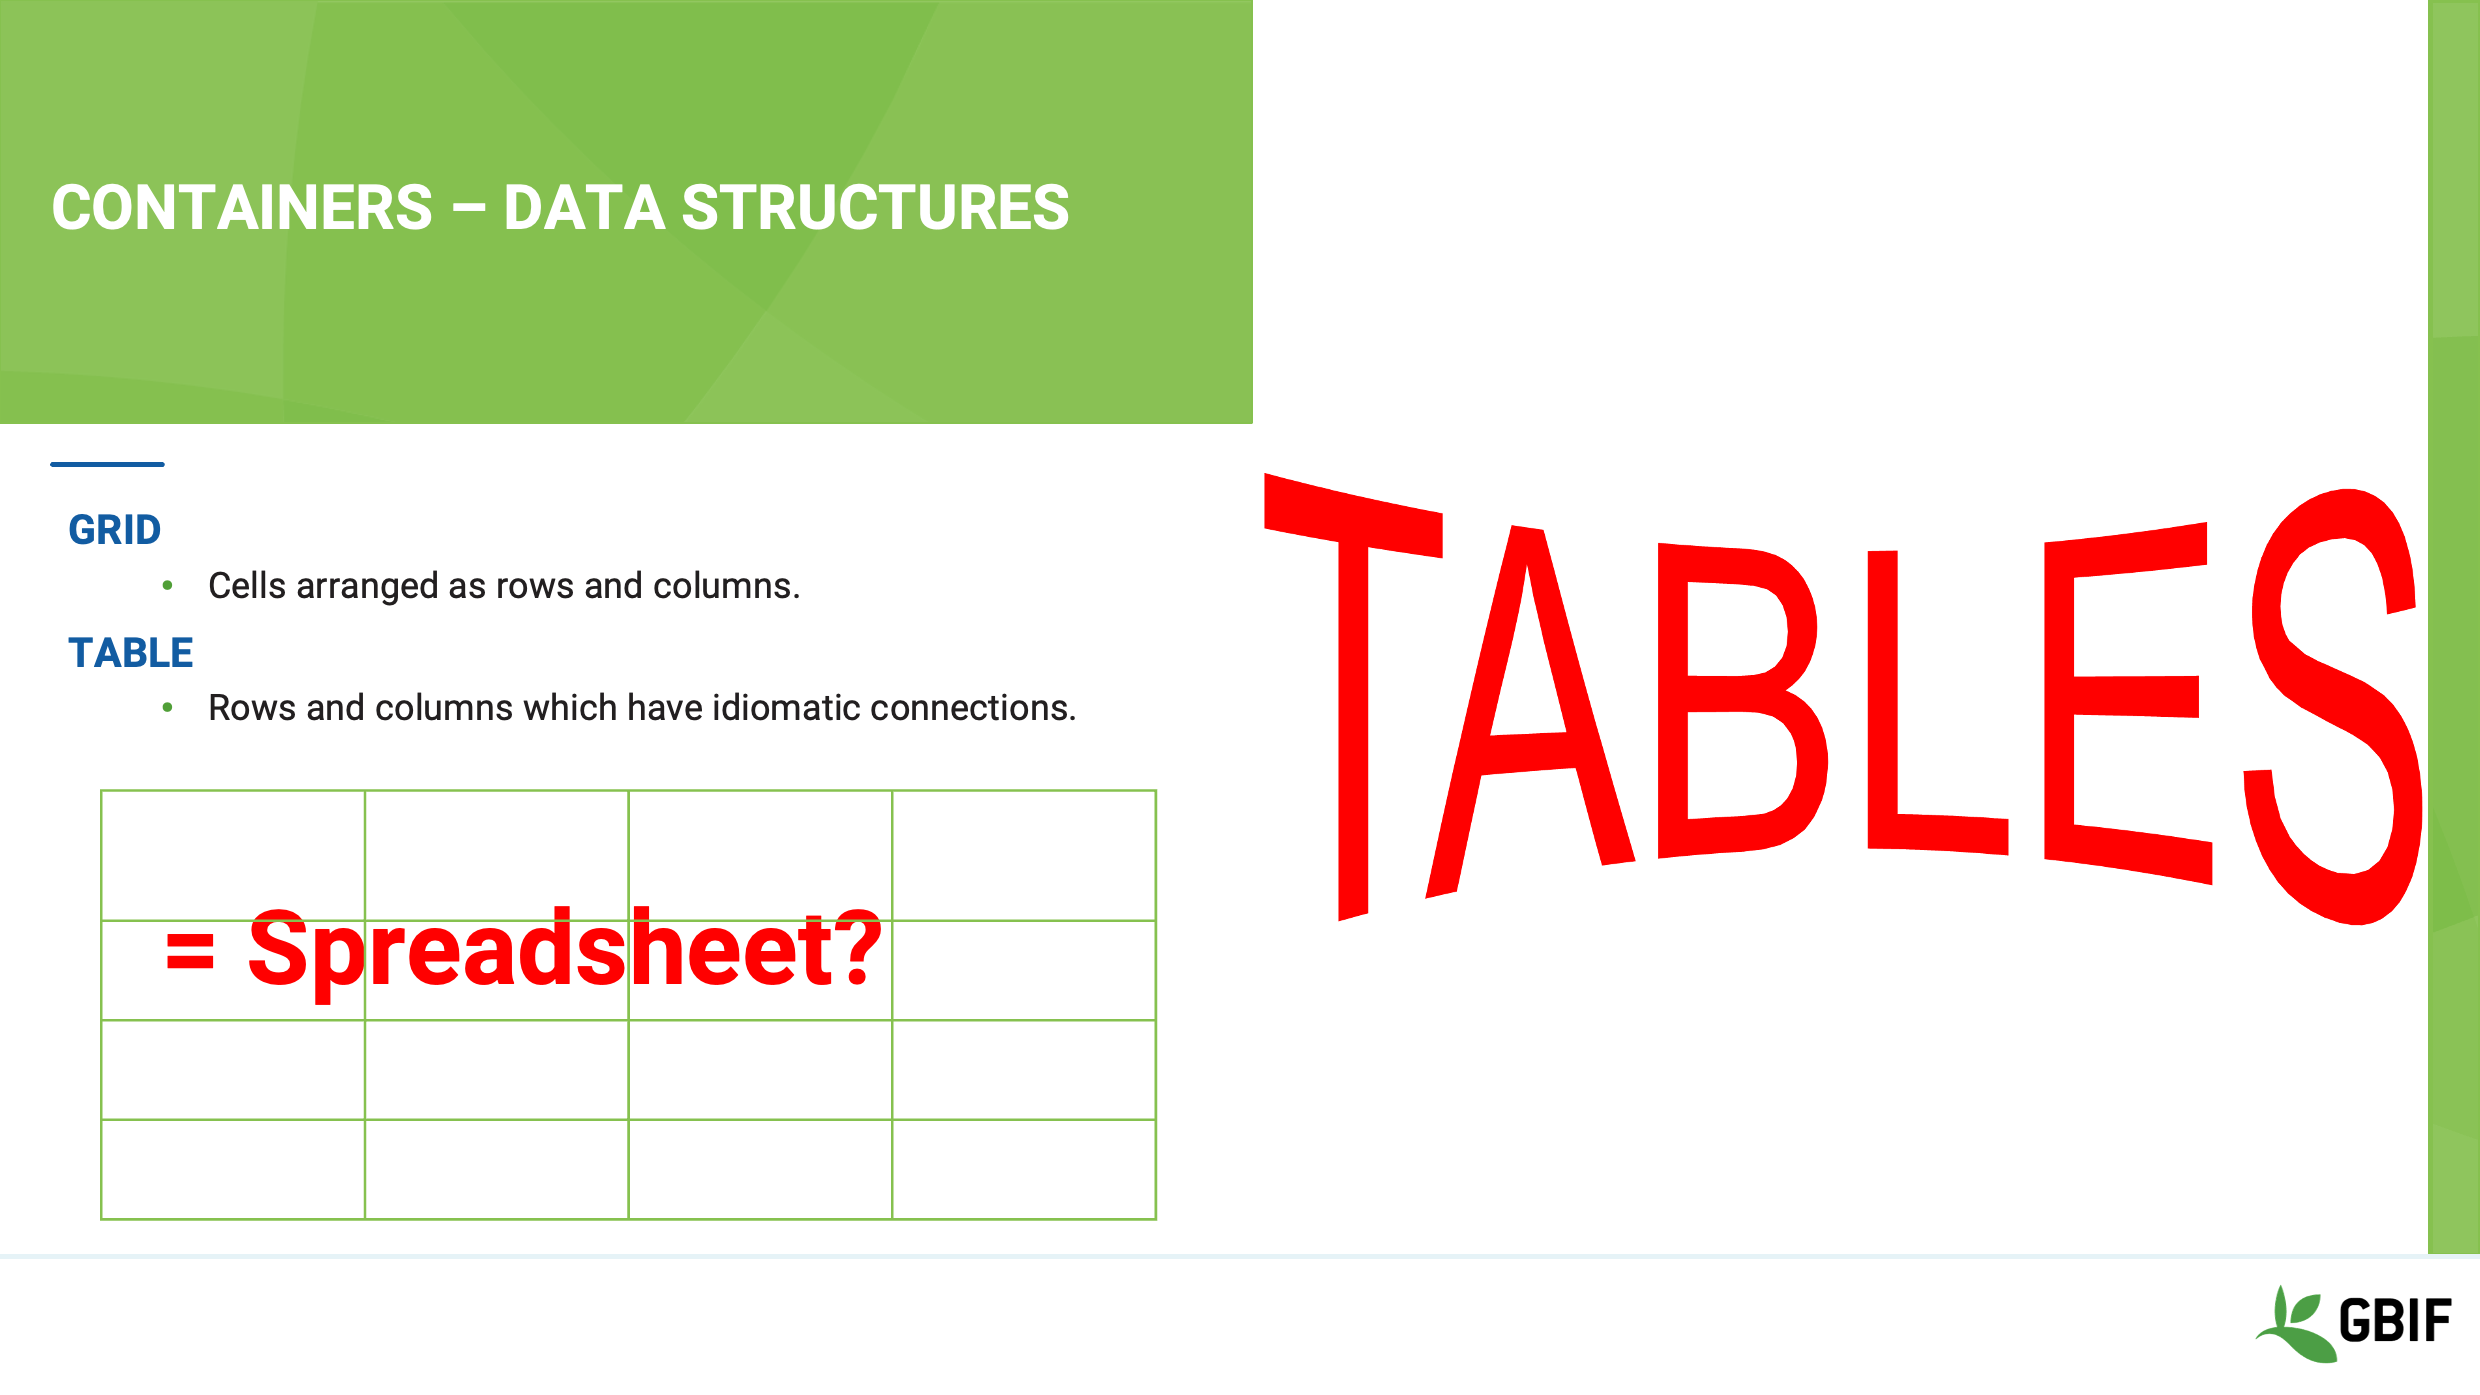
Slide 17 - Containers - Data structures
When you organize cells into rows and columns, obviously, what you get is a grid!
This is looks very much like a spreadsheet right?
Well, yes. The difference however between a spreadsheet grid and a table are the strength of the ties that hold the rows and columns together.
Slide 18 - Structures - planes, trains and automobiles
So let’s now talk about those connections.
What the implications for the integrity and security of your data of loose unenforced relationships between rows and columns?
Slide 19 - Data structures
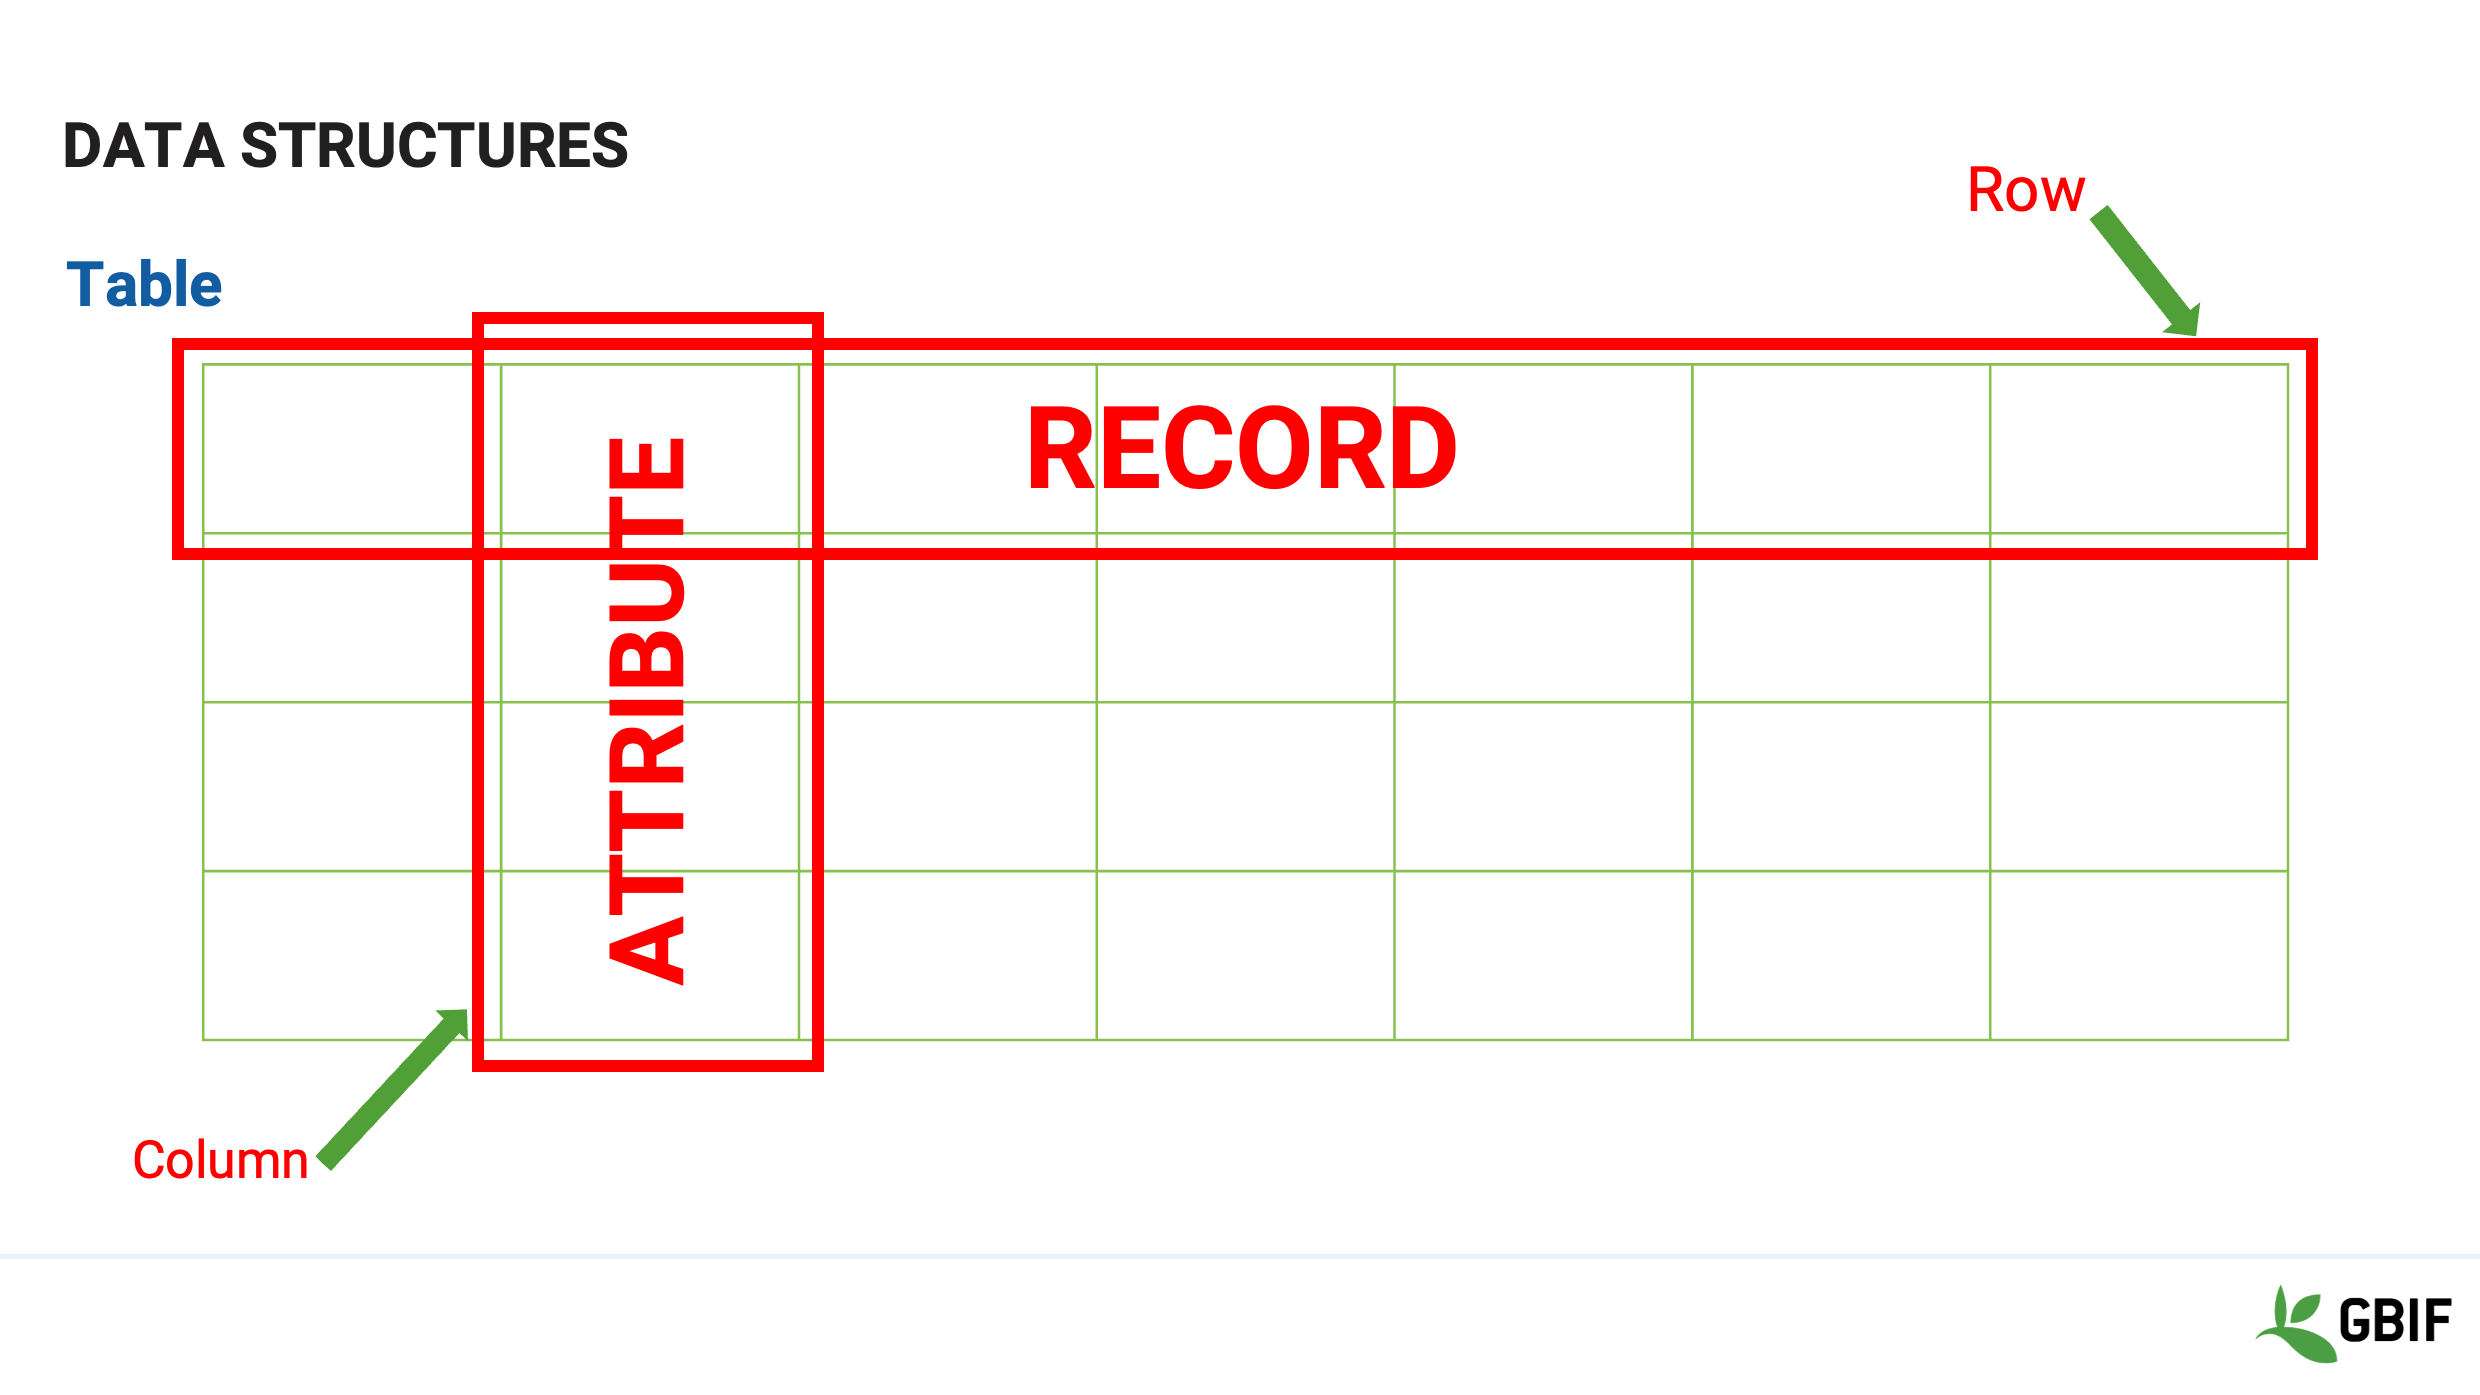
What actually makes a table useful are the connections that we create to give the data in the structure meaning.
We intrinsically make patterns of attributes that turns data into information.
Rows become records and Columns become attributes
In a spreadsheet however, the connections between cells are idiomatic, loose and un-enforced.
It is easy for the attributes between the rows to get jumbled up or for the values get changed and then the meaning is lost.
Slide 20 - Integrity and security
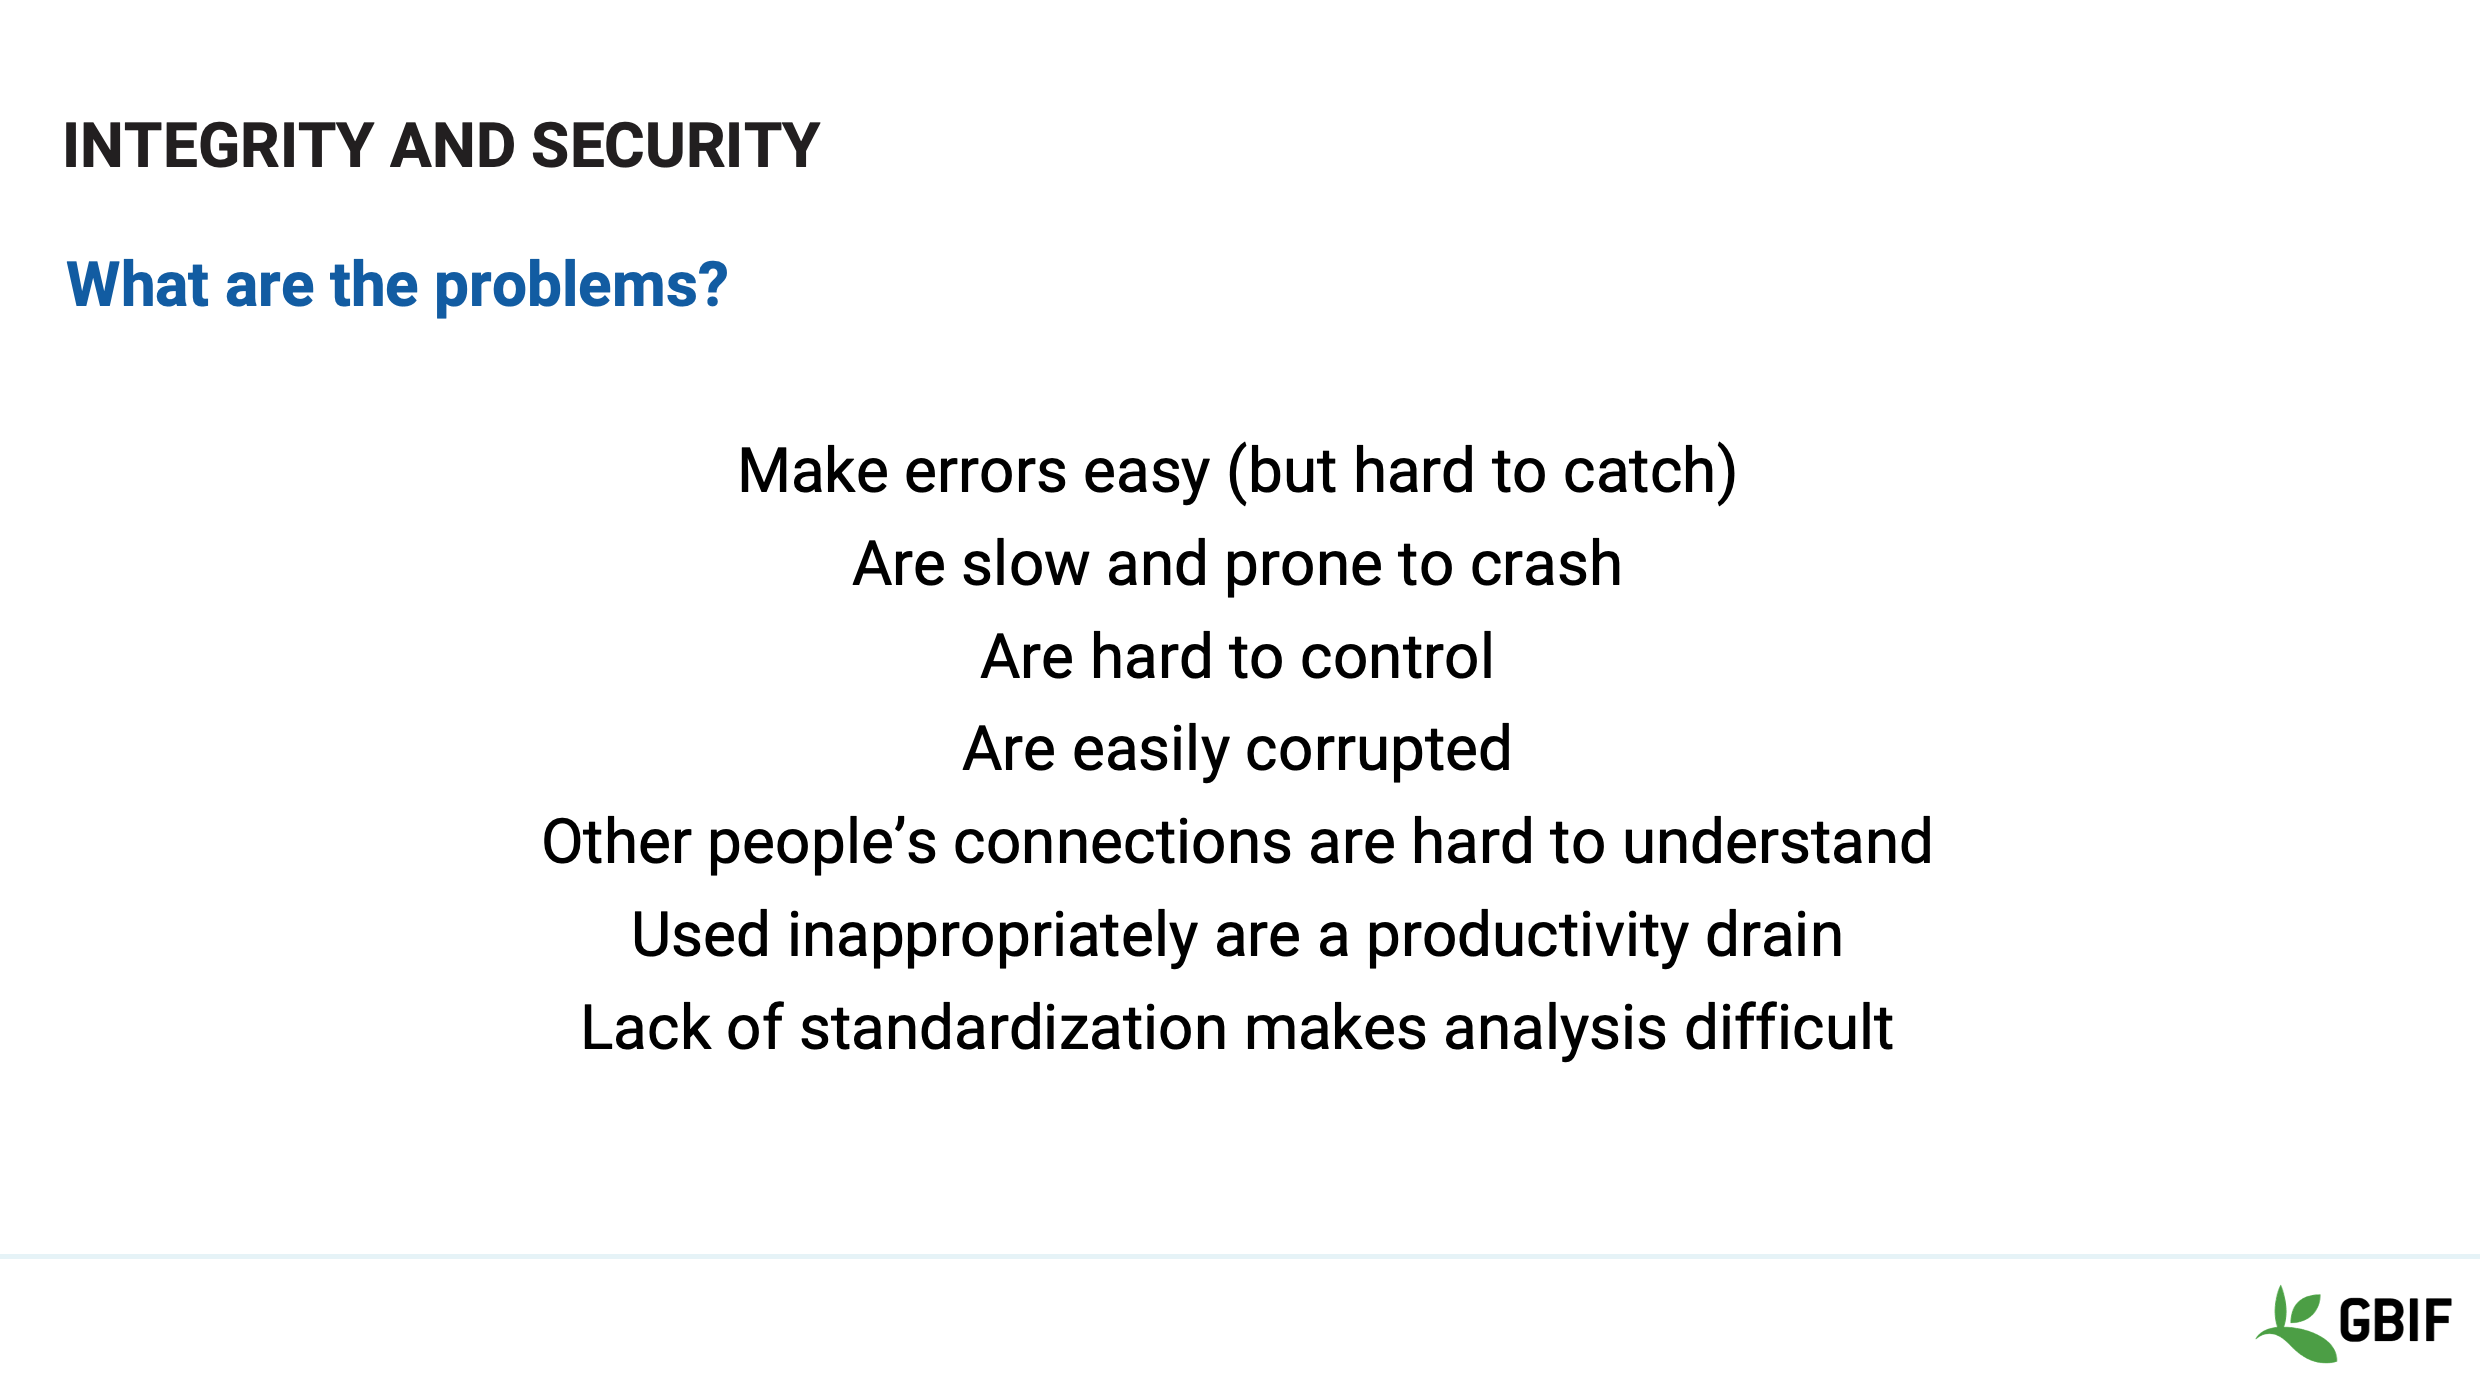
This lack of enforced connections makes a spreadsheet easy to use but these same qualities also cause problems.
Errors are easy to make and hard to catch.
Connections and relationships are not documentable and so subject to interpretation and mutation.
Spreadsheets are not built to scale either in terms of size or numbers of users.
So can be slow, crashy and easily corruptible
Spreadsheets are easy to copy and email
So they are hard to version and keep track of
The question is what is the solution?
Slide 21 - Containers - Integrity and security
Let’s look back, at the connections in a bit more detail.
We generally understand that the data in each row of a table means something.
For example each row can represent a specimen or a taxa that was found at a particular place, at a particular time, by a particular person.
It would be odd to have one row in a table that represents a specimen followed by a row that represents a collection site.
We also often want to analyse, sort and compare values of particular attributes between rows.
For example you may want find the mean weight of all the Kenyan bats.
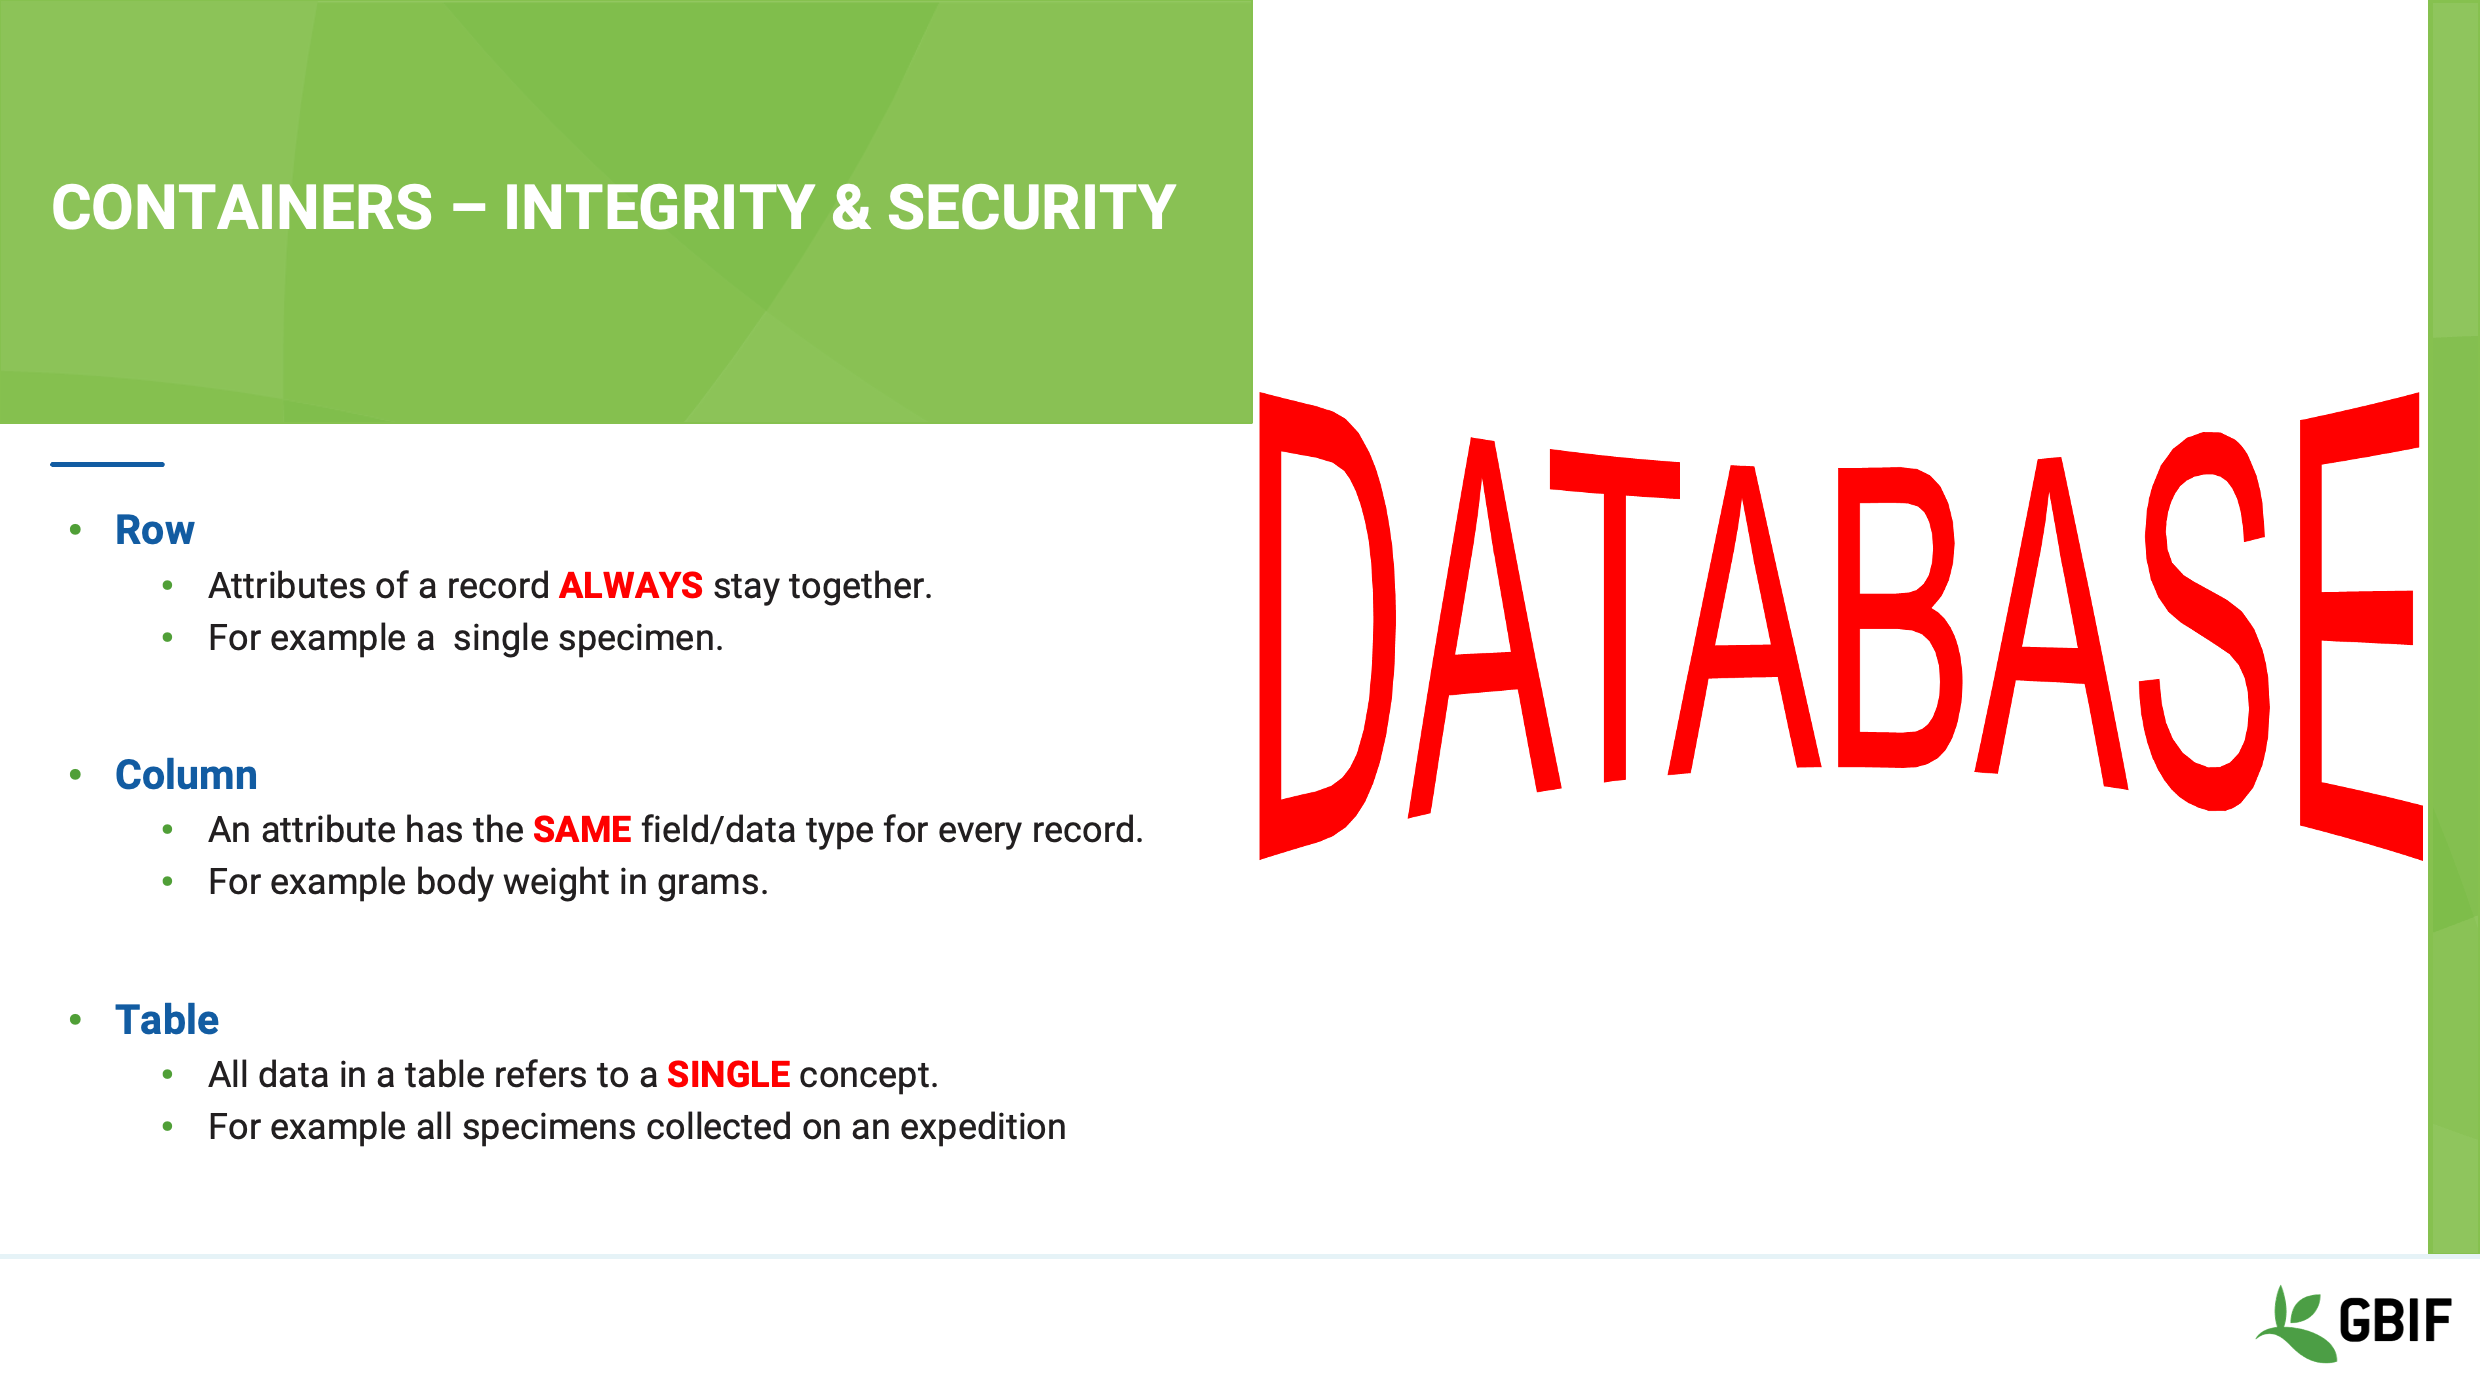
So ideally we want to use a system to store our data that:
-
always holds the rows together
-
does not mix data types
-
and segregates data in each table to a single concept or theme
These are functions of a database!
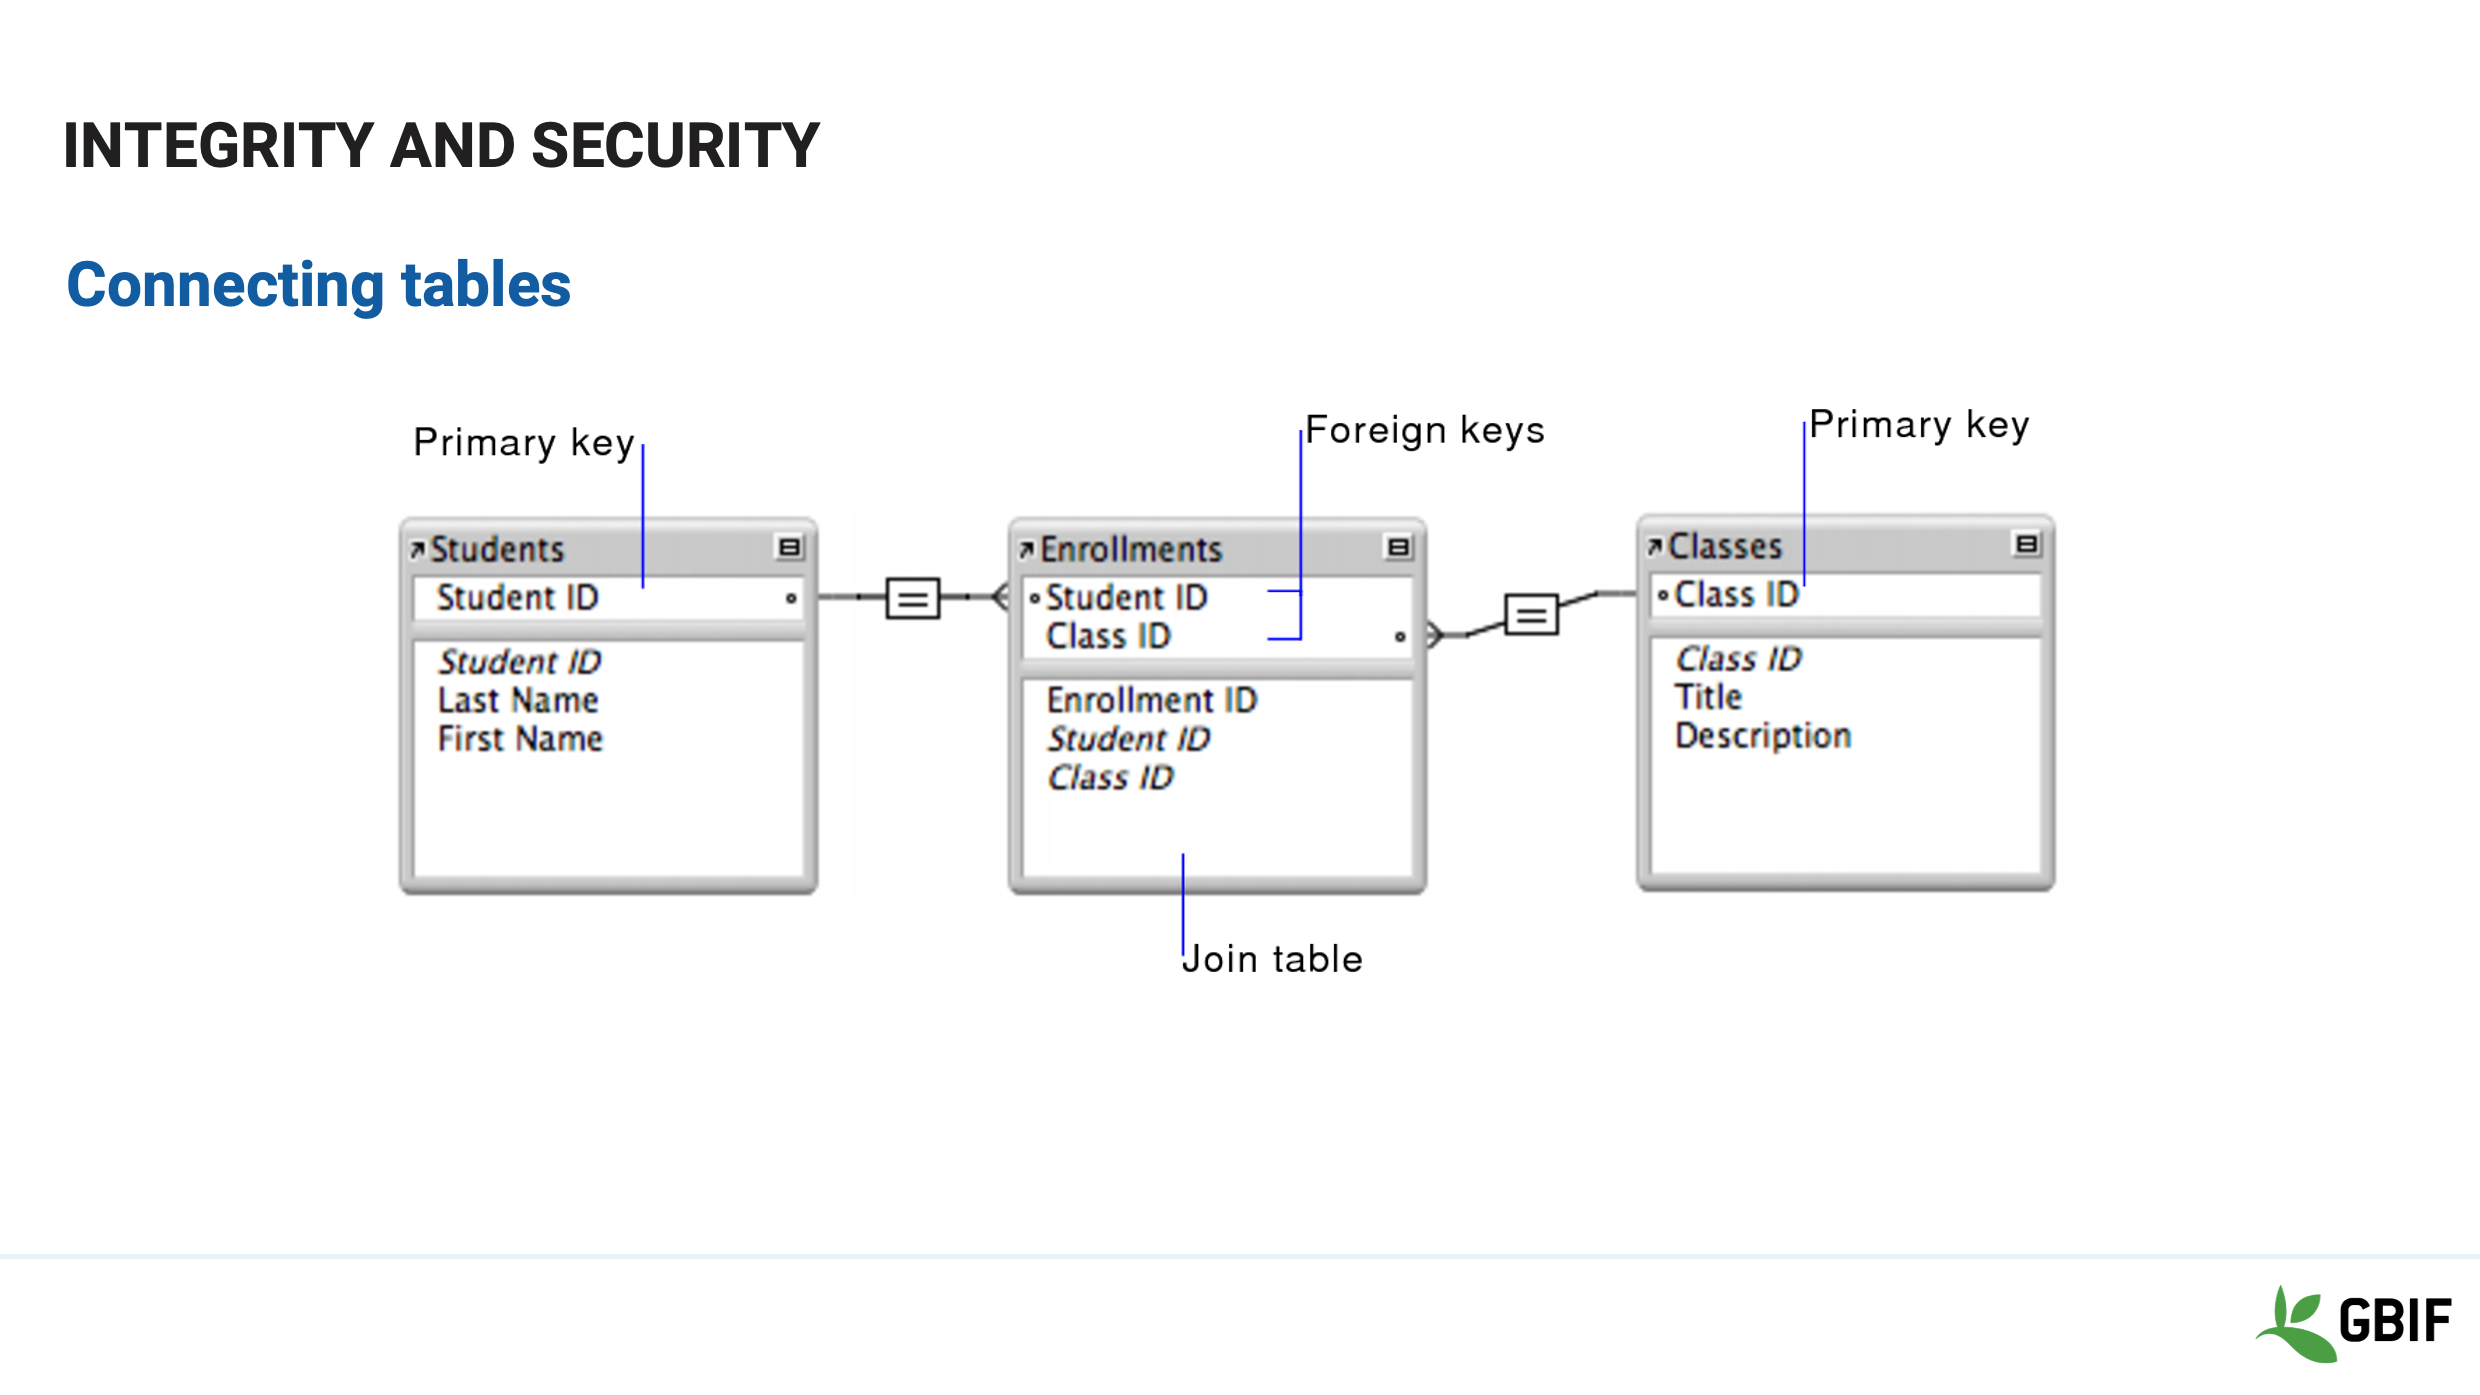
Slide 22 - Integrity and security
Functions in a true database inherently bind rows together and columns may only have a single data type.
Tables in database are held together by virtual links called keys.
These keys are identifiers that match between tables and allow data to be connected efficiently.
It is these 2 key concepts that distinguish a spreadsheet from a database.
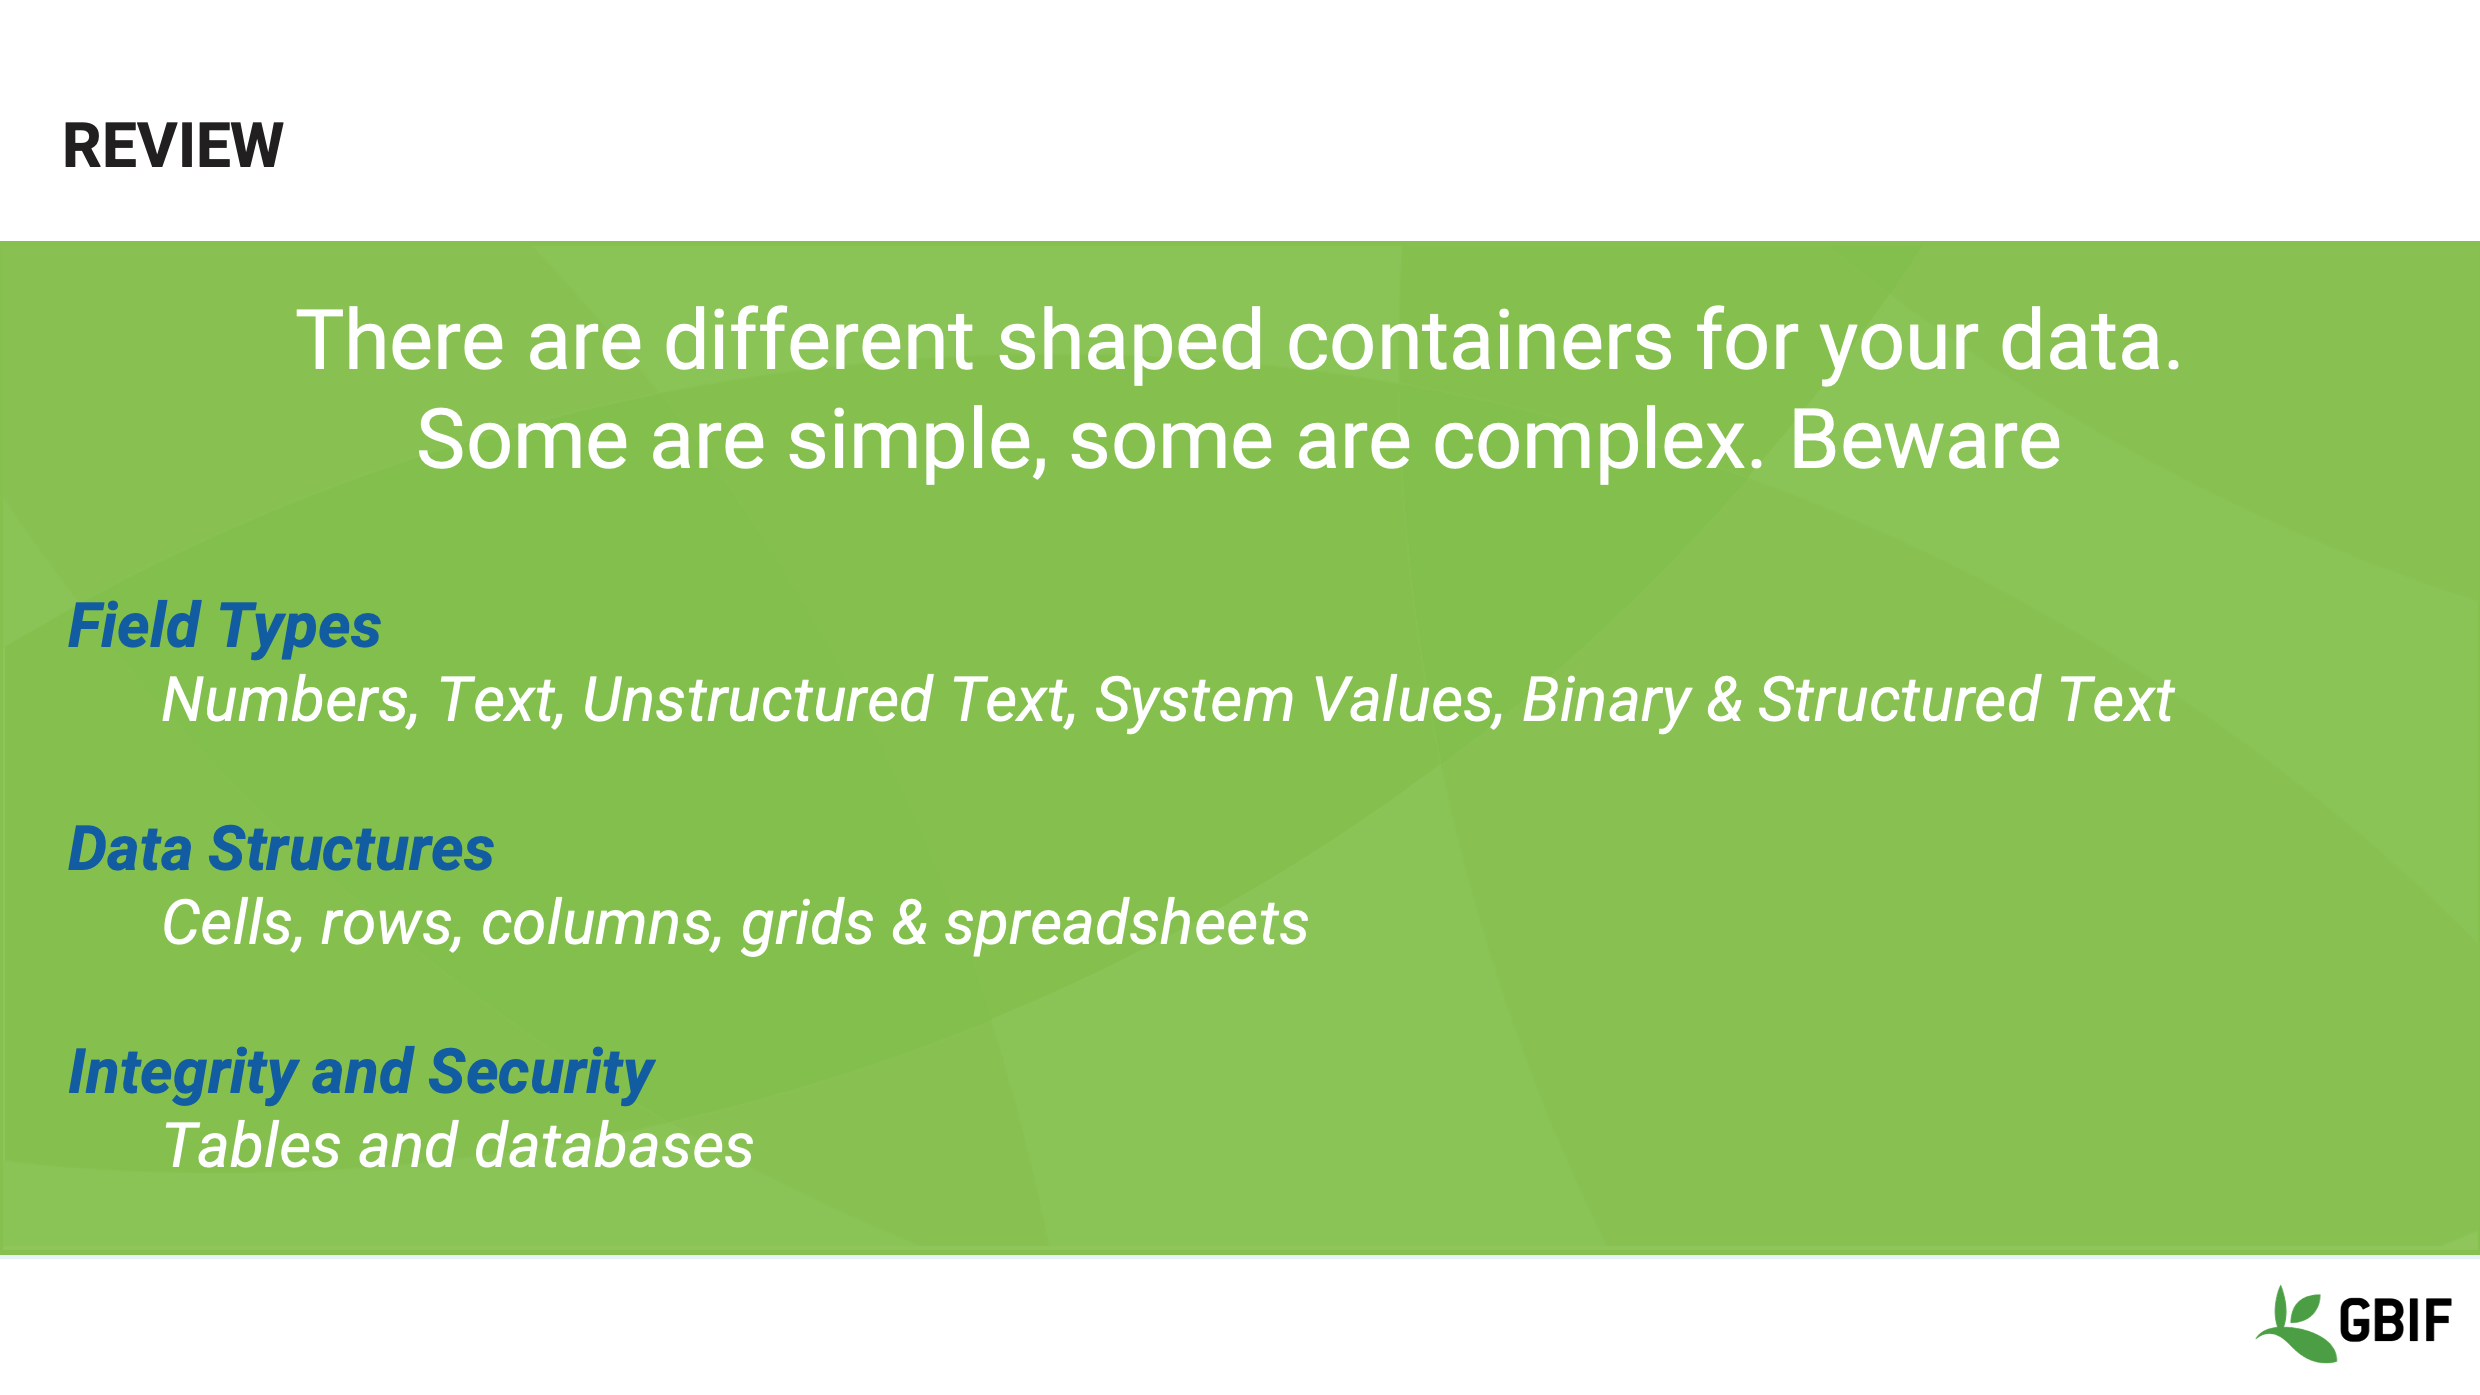
Slide 23 - Review
In review then, we have looked at the 6 most common data types, the basic building blocks of data structure and distinguished between a spreadsheet grid and database table.
Understanding these elements and how they interact with one another will allow you to better determine the best ways to manipulate and document the data that falls under your custodianship.
Slide 24 - Wrap-up
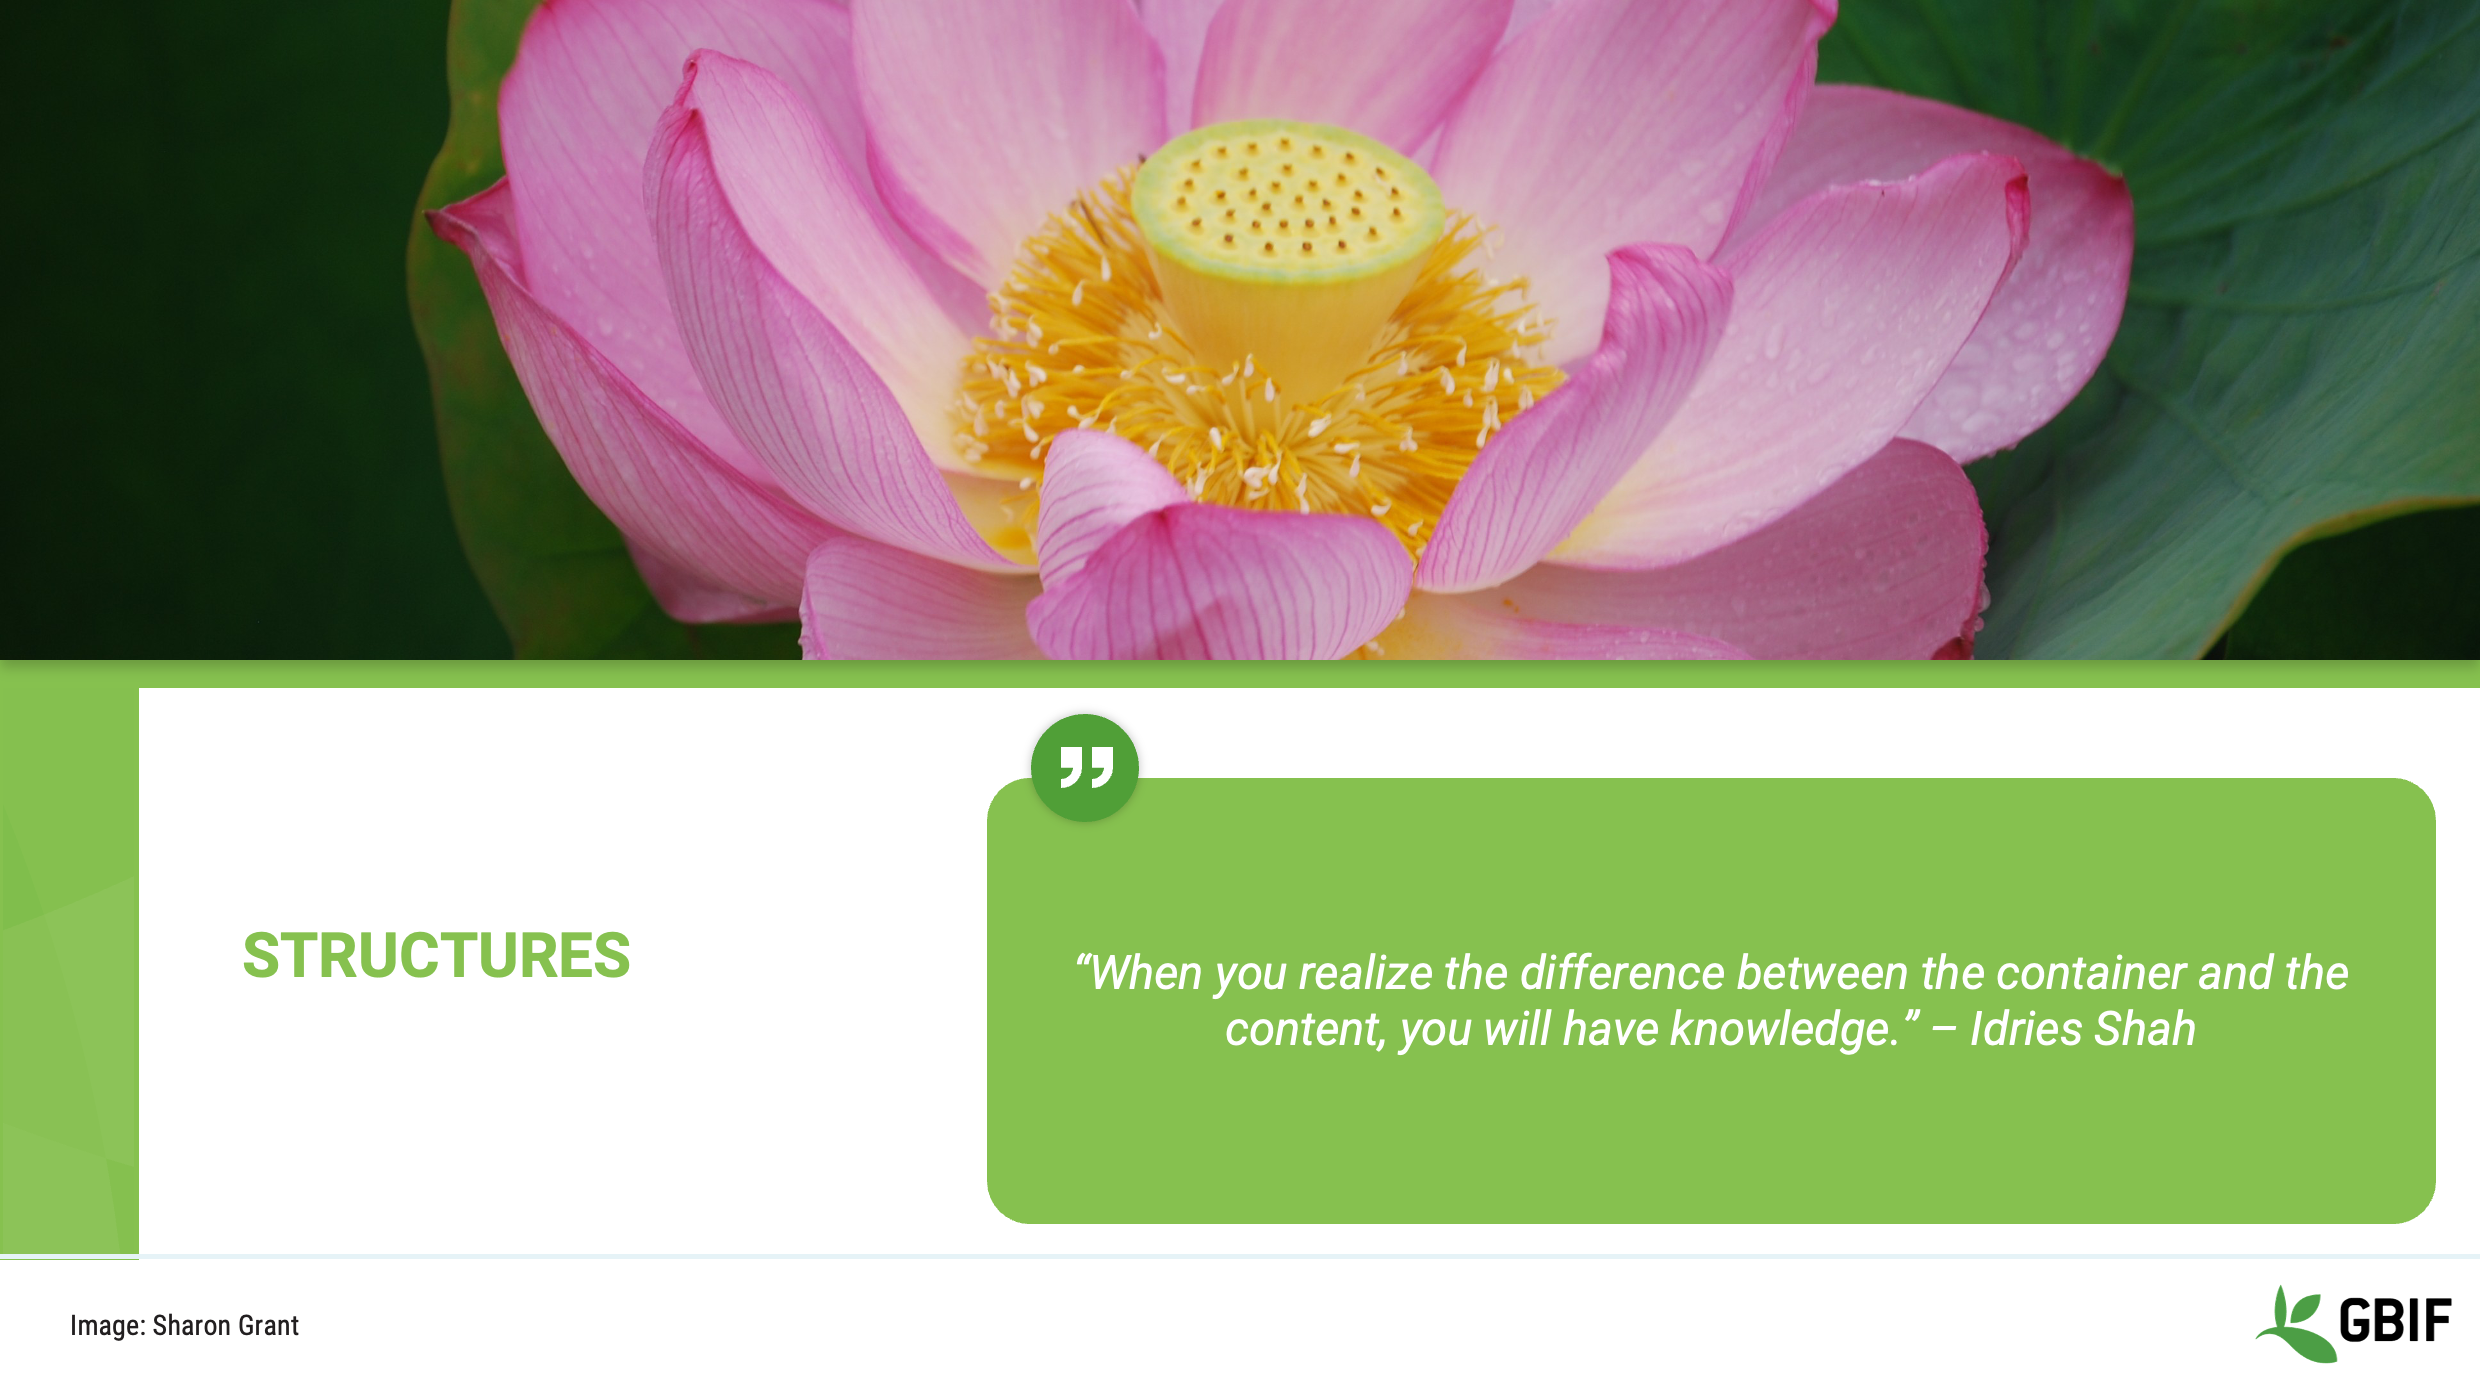
Remember that:
“When you realize the difference between the container and the content, you will have knowledge.”
Using the correct terms to describe both your data and the structures that you create and use to store it; is the most important way to ensure that it remains relevant and useable.
Never underestimate how much damage can be done to priceless information by careless descriptions and storage.
Slide 25 - Conclusion
This video is part of a series of presentations used in the GBIF Biodiversity Data Mobilization course. The biodiversity data mobilization curriculum was originally developed as part of the Biodiversity Information Development Programme funded by the European Union.
This presentation was originally created and narrated by Sharon Grant with additional contributions by BID and BIFA Trainers, Mentors and Students.