Data processing and quality

In this module, you will learn how to determine if data is fit for your purpose and how reviewing GBIF data quality issues and flags can help you process the data you are using for your research.

Depending on your research question, you will need to decide if the available data/datasets are fit for your purpose.This will include evaluating the quality of the data.

In this video (12:26), you will review some of the principles for fitness for use and data quality. This video’s audience is directed towards the publishers of data, but many of the same principles apply to users of data. If you are unable to watch the embedded YouTube video, you can download it locally on the Files for download page.

Determining fitness for use

For one person, data identified to the level of Genus may be sufficient to run predictive models of ecological niches. For a person studying a particular taxon, that same genus-level data will be much less useful than more detailed occurrences with subspecies information.

Based on the principles that Arthur Chapman discusses in the Principles of Data Quality (2005), you should reflect on some important questions about the data to help you decide if data is trustworthy or useful enough for your purpose:

  1. How Accurate are the data? For example, are the identifications current and were they made by known experts?

  2. How Timely are the data? When was the data made available? How often has it been updated?

  3. How Complete or Comprehensive are the data? How well does the data cover a particular time, place, or domain?

  4. How Consistent are the data? Are the data in each field always of the same type? Was the data collected using the same documented protocols?

  5. How Relevant are the data? How similar is the dataset to others that have been used successfully for the same purpose?

  6. How Detailed are the data? How much resolution is there in the data? At what scale can the data be used for mapping?

  7. Is the data Easy to interpret? Is the dataset (metadata) documented in a clear and concise way?
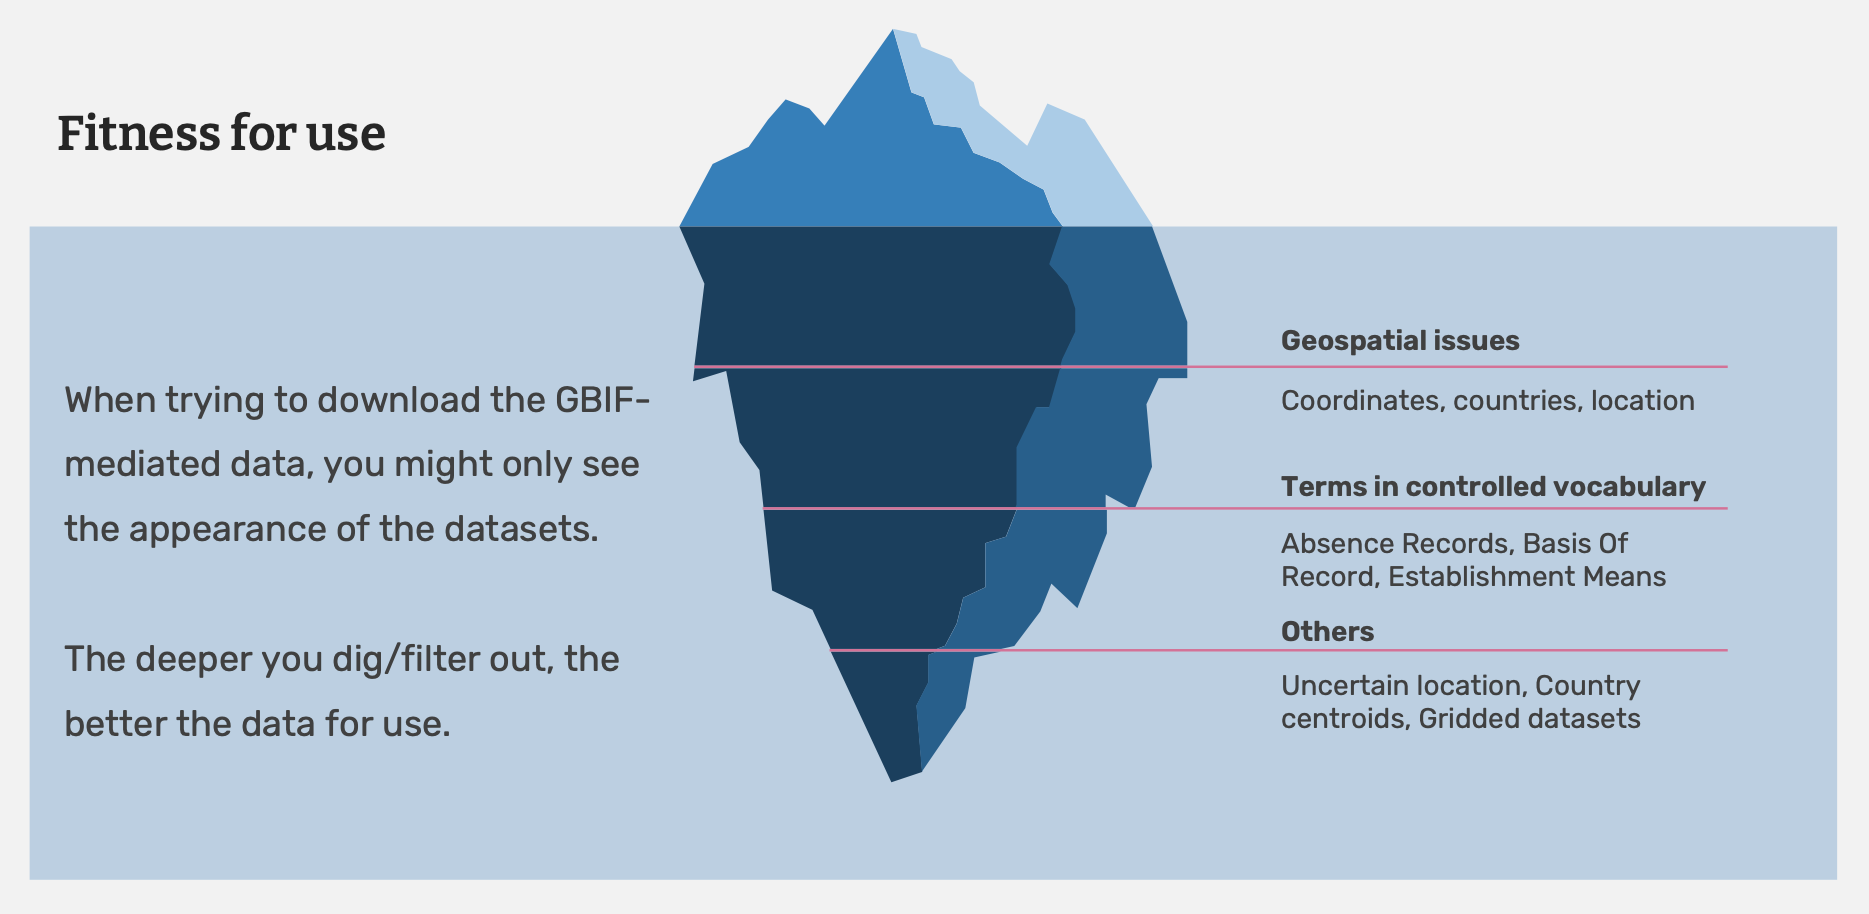
fitnessforuse
Image by Melissa Liu

Evaluating data quality

If you have determined a dataset in fit for your purpose, you need to further examine the dataset and complete post-download processing of the data. GBIF downloads contain data from a range of sources and the data will likely vary in its measures of quality. Knowing the properties of the data you have will help you to understand the ways in which you can and cannot clean, validate and process the data.

Below you will find a selected reading from Arthur Chapman’s guide “Principles of data quality”. Full document, references and translations can be found on GBIF.org.

Before a detailed discussion on data quality and its application to species-occurrence data can take place, there are a number of concepts that need to be defined and described. These include the term data quality itself, the terms accuracy and precision that are often misapplied, and what we mean by primary species data and species-occurrence data.

Species-occurrence data

Species-occurrence data is used here to include specimen label data attached to specimens or lots housed in museums and herbaria, observational data and environmental survey data. In general, the data are what we term “point-based”, although line (transect data from environmental surveys, collections along a river), polygon (observations from within a defined area such as a national park) and grid data (observations or survey records from a regular grid) are also included. In general we are talking about georeferenced data – i.e. records with geographic references that tie them to a particular place in space – whether with a georeferenced coordinate (e.g. latitude and longitude, UTM) or not (textual description of a locality, altitude, depth) – and time (date, time of day).

In general the data are also tied to a taxonomic name, but unidentified collections may also be included. The term has occasionally been used interchangeably with the term “primary species data”.

Primary species data

“Primary species data” is used to describe raw collection data and data without any spatial attributes. It includes taxonomic and nomenclatural data without spatial attributes, such as names, taxa and taxonomic concepts without associated geographic references.

Accuracy and Precision

Accuracy and precision are regularly confused and the differences are not generally understood.

Accuracy refers to the closeness of measured values, observations or estimates to the real or true value (or to a value that is accepted as being true – for example, the coordinates of a survey control point).

Precision (or Resolution) can be divided into two main types. Statistical precision is the closeness with which repeated observations conform to themselves. They have nothing to do with their relationship to the true value, and may have high precision, but low accuracy. Numerical precision is the number of significant digits that an observation is recorded in and has become far more obvious with the advent of computers. For example a database may output a decimal latitude/longitude record to 10 decimal places – i.e. ca .01 mm when in reality the record has a resolution no greater than 10-100 m (3-4 decimal places). This often leads to a false impression of both the resolution and the accuracy.

These terms – accuracy and precision – can also be applied to non-spatial data as well as to spatial data. For example, a collection may have an identification to subspecies level (i.e. have high precision), but be the wrong taxon (i.e. have low accuracy), or be identified only to Family level (high accuracy, but low precision).

Data quality

Data quality is multidimensional, and involves data management, modelling and analysis, quality control and assurance, storage and presentation. As independently stated by Chrisman (1991) and Strong et al. (1997), data quality is related to use and cannot be assessed independently of the user. In a database, the data have no actual quality or value (Dalcin 2004); they only have potential value that is realized only when someone uses the data to do something useful. Information quality relates to its ability to satisfy its customers and to meet customers’ needs (English 1999).

Redman (2001), suggested that for data to be fit for use they must be accessible, accurate, timely, complete, consistent with other sources, relevant, comprehensive, provide a proper level of detail, be easy to read and easy to interpret.

One issue that a data custodian may need to consider is what may need to be done with the database to increase its usability to a wider audience (i.e. increase its potential use or relevance) and thus make it fit for a wider range of purposes. There will be a trade off in this between the increased usability and the amount of effort required to add extra functionality and usability. This may require such things as atomizing data fields, adding geo-referencing information, etc.

Quality Assurance/ Quality Control

The difference between quality control and quality assurance is not always clear. Taulbee (1996) makes the distinction between Quality Control and Quality Assurance and stresses that one cannot exist without the other if quality goals are to be met. She defines Quality Control as a judgement of quality based on internal standards, processes and procedures established to control and monitor quality; and Quality Assurance as a judgement of quality based on standards external to the process and is the reviewing of the activities and quality control processes to insure that the final products meet predetermined standards of quality.

In a more business-oriented approach, Redman (2001) defines Quality Assurance as “those activities that are designed to produce defect-free information products to meet the most important needs of the most important customers, at the lowest possible cost”.

How these terms are to be applied in practice is not clear, and in most cases the terms seem to be largely used synonymously to describe the overall practice of data quality management.

Uncertainty

Uncertainty may be thought of as a “measure of the incompleteness of one’s knowledge or information about an unknown quantity whose true value could be established if a perfect measuring device were available” (Cullen and Frey 1999). Uncertainty is a property of the observer’s understanding of the data, and is more about the observer than the data per se. There is always uncertainty in data; the difficulty is in recording, understanding and visualizing that uncertainty so that others can also understand it. Uncertainty is a key term in understanding risk and risk assessment.

Error

Error encompasses both the imprecision of data and their inaccuracies. There are many factors that contribute to error. Error is generally seen as being either random or systematic. Random error tends to refer to deviation from the true state in a random manner. Systematic error or bias arises from a uniform shift in values and is sometimes described as having ‘relative accuracy’ in the cartographic world (Chrisman 1991). In determining ‘fitness for use’ systematic error may be acceptable for some applications, and unfit for others.

An example may be the use of a different geodetic datum1 – where, if used throughout the analysis, may not cause any major problems. Problems will arise though where an analysis uses data from different sources and with different biases – for example data sources that use different geodetic datums, or where identifications may have been carried out using an earlier version of a nomenclatural code.

“Because error is inescapable, it should be recognized as a fundamental dimension of data” (Chrisman 1991). Only when error is included in a representation of the data is it possible to answer questions about limitations in the data, and even limitations in current knowledge. Known errors in the three dimensions of space, attribute and time need to be measured, calculated, recorded and documented.

Validation and Cleaning

Validation is a process used to determine if data are inaccurate, incomplete, or unreasonable. The process may include format checks, completeness checks, reasonableness checks, limit checks, review of the data to identify outliers (geographic, statistical, temporal or environmental) or other errors, and assessment of data by subject area experts (e.g. taxonomic specialists). These processes usually result in flagging, documenting and subsequent checking of suspect records. Validation checks may also involve checking for compliance against applicable standards, rules, and conventions. A key stage in data validation and cleaning is to identify the root causes of the errors detected and to focus on preventing those errors from re-occurring (Redman 2001).

Data cleaning refers to the process of “fixing” errors in the data that have been identified during the validation process. The term is synonymous with “data cleansing”, although some use data cleansing to encompass both data validation and data cleaning. It is important in the data cleaning process that data is not inadvertently lost, and changes to existing information be carried out very carefully. It is often better to retain both the old (original data) and the new (corrected data) side by side in the database so that if mistakes are made in the cleaning process, the original information can be recovered.