Caso de Uso - Monitoreo de mariposas
|
Familiarícese con el escenario del caso de uso. En el apéndice de soluciones se propondrá una solución. Este Caso de Uso no se califica. |
Escenario
Monitoreo de mariposas
Esta narrativa se elaboró como base para ejercicios prácticos en el curso de movilización de datos de biodiversidad, y el concepto y el contenido de los ejercicios fueron desarrollados por Kate Ingenloff y Laura Anne Russell, basándose en trabajos previos de Alberto González-Talaván, Danny Vélez, Larissa Smirnova, Laura Anne Russell, Mélianie Raymond y Nicolas Noé.
Se trata de un escenario ficticio basado en datos reales y con fines meramente didácticos. El conjunto de datos original se atribuye a Pettersson L B (2025). Swedish Butterfly Monitoring Scheme (SeBMS). Versión 1.12. Departamento de Biología, Universidad de Lund. Conjunto de datos de eventos de muestreo https://doi.org/10.15468/othndo consultado a través de GBIF.org el 12 de abril de 2026.
Descripción
La Red Sueca de Mariposas (SBN, por sus siglas en inglés) lleva desde 2009 monitoreando la presencia de mariposas (Lepidoptera) en una serie de lugares fijos entre 3 y 7 veces por temporada, anualmente.
Esta red de observadores implementa uno de dos protocolos estándar en cada sitio: recorridos Pollard de ruta fija o conteos puntuales. Los observadores registran la información de observación de mariposas en hojas de registro de datos en papel que envían a la oficina nacional de la SBN.
El comité directivo de SBN desea comenzar a publicar estos datos en línea en GBIF con el fin de fortalecer la colaboración con la Agencia Sueca de Protección Ambiental, la Administración Sueca de Transportes y las Juntas de Administración de los Condados Suecos para influir en las políticas de conservación de los lepidópteros en Suecia.
Recopilación de datos
El programa lleva a cabo anualmente censos de mariposas en más de 500 sitios, a cargo de voluntarios, desde el 1 de abril hasta el 30 de septiembre. Cada sitio se visita entre 3 y 7 veces por temporada. El programa no establece las fechas de los censos, pero sí ofrece recomendaciones (véase la tabla a continuación).
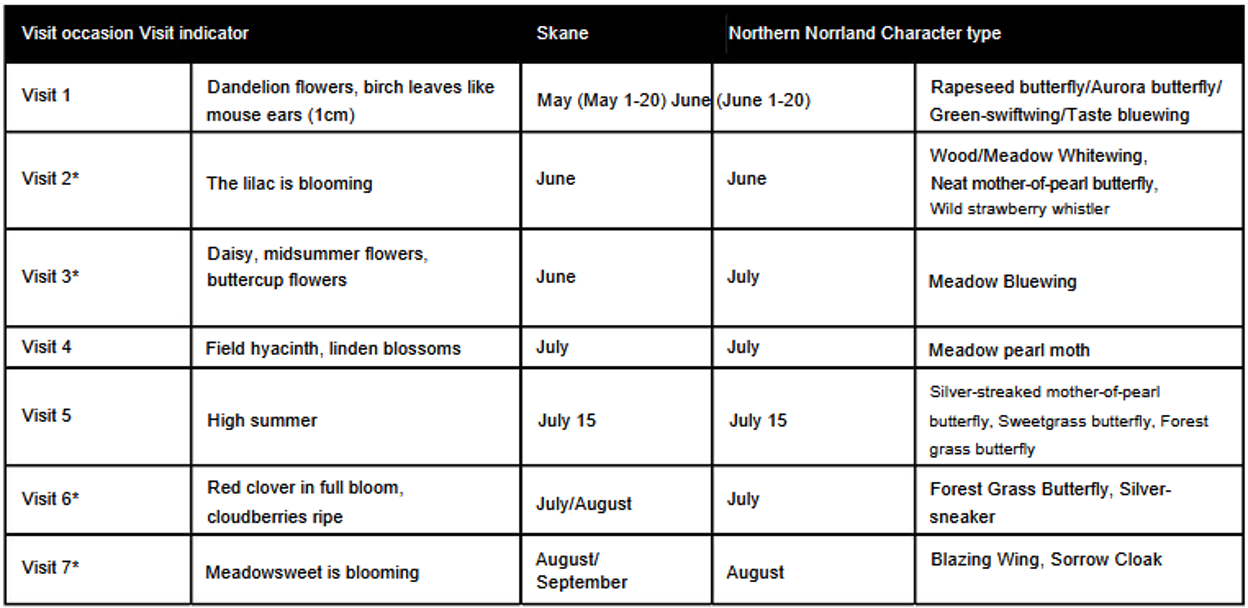
El programa de monitoreo implementa dos métodos establecidos: transectas de recorrido fijo de Pollard y conteos puntuales. Cada año se utiliza el mismo método en cada sitio. Estos métodos se describen en Pollard y Yates (1993) y Pettersson et al. (2011 y 2022) y permiten que el programa de monitoreo evalúe los cambios anuales en (1) la cantidad de mariposas observadas y (2) la composición de especies.
*Transectas Pollard a pie de ruta fija *
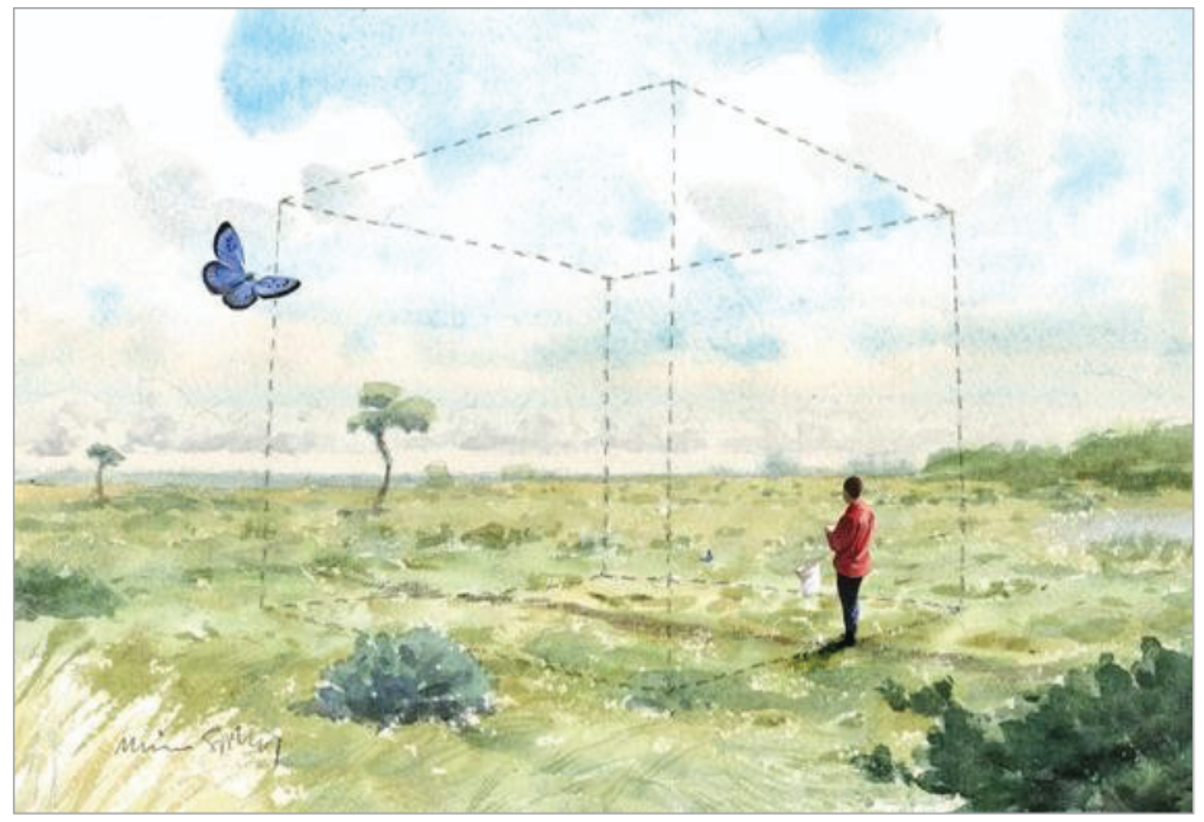
Las transectas de Pollard de ruta fija son recorridos predefinidos que suelen tener una longitud de entre 0,5 y 3 km. Los observadores siguen la transecta a un ritmo constante e identifican todas las mariposas que observan hasta 5 m delante, 5 m por encima y 2,5 m a cada lado (véase la figura siguiente).
Una transecta puede tener cualquier forma, incluido un bucle. Cada transecta es inventariada una vez por visita. Algunas transectas se dividen en segmentos que suelen representar un cambio de hábitat. Por ejemplo, un bucle que sigue una carretera forestal, pasa por un claro y luego sale a una turbera tendrá tres segmentos. Cada segmento es inventariado una vez por visita.
Cada registro de reconocimiento de una caminata de ruta fija de Pollard incluirá la siguiente información:
-
Fecha del levantamiento
-
Coordenadas del lugar en EPSG:3857 que representan el punto central del lugar
-
Hora de inicio/fin de cada segmento (si aplica) o del levantamiento completo
-
Condiciones meteorológicas durante cada segmento (si aplica) o durante todo el levantamiento
-
Una lista de las especies observadas y el número total de cada especie observada en cada segmento (si aplica) o, en su defecto, para el levantamiento completo. Los muestreos o segmentos en los que no se hayan observado mariposas incluirán una nota indicando que no se han observado mariposas.
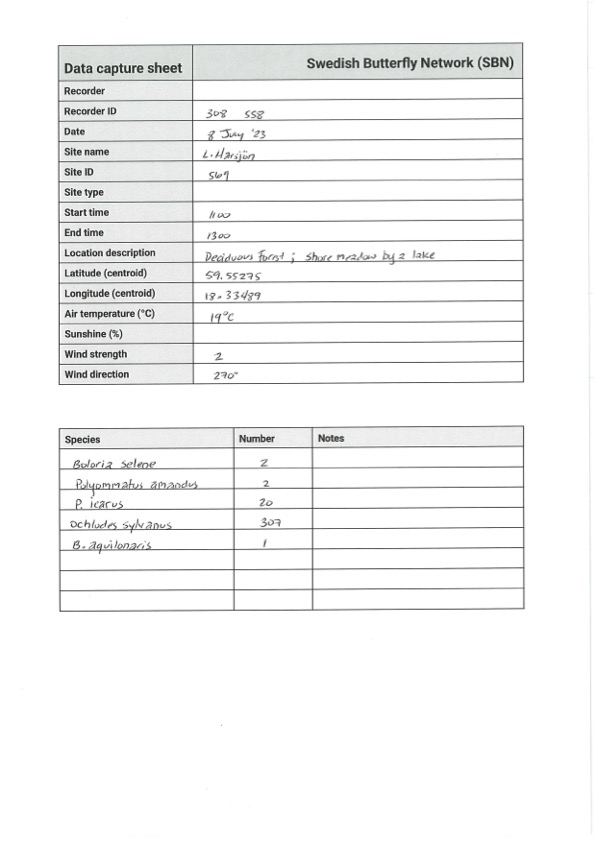
| Las especies inusuales o difíciles de identificar se marcan con un asterisco (*) en los registros de muestreo y el observador adjunta una fotografía para facilitar su identificación. Si el observador no pudo obtener una fotografía, la mariposa se clasifica como «mariposa indeterminada». |
Sitios de recuento de puntos
Los sitios de recuento de puntos abarcan un área con un radio de 25 m y una altura de 5 m que se inspeccionan durante 15 minutos por visita. Un sitio puede ser completamente circular con un radio de 25 metros o puede tener otras formas. Independientemente de la forma, debe inventariarse la misma zona en cada ocasión para garantizar que el inventario sea comparable en todos los levantamientos.
Para un punto circular, el observador se desplaza por el punto circular durante los 15 minutos y registra todas las mariposas que entran en el círculo hasta 5 m por encima del suelo. Véase la figura siguiente.
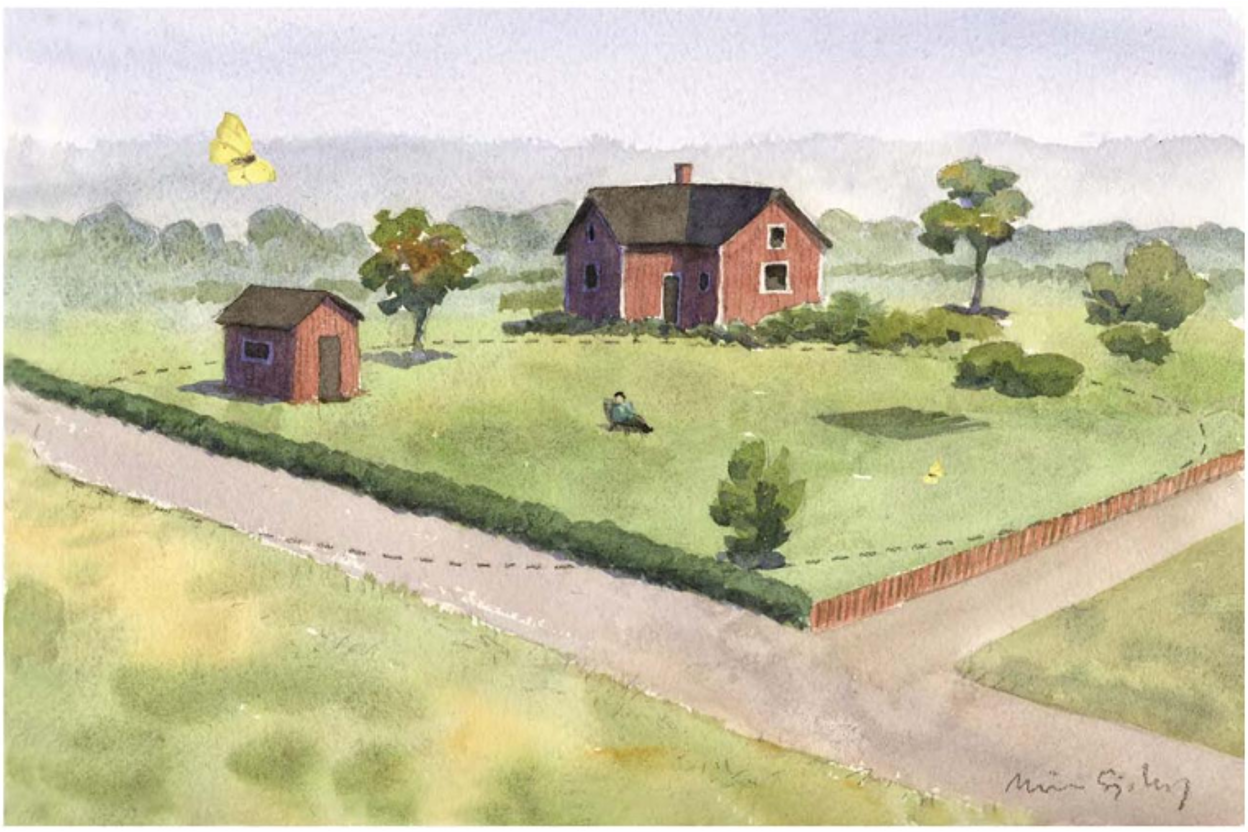
Para un punto no circular, el observador camina por el lugar durante los 15 minutos y registra todas las mariposas que observa en el área hasta 5 m por encima del suelo. Véase la figura siguiente.
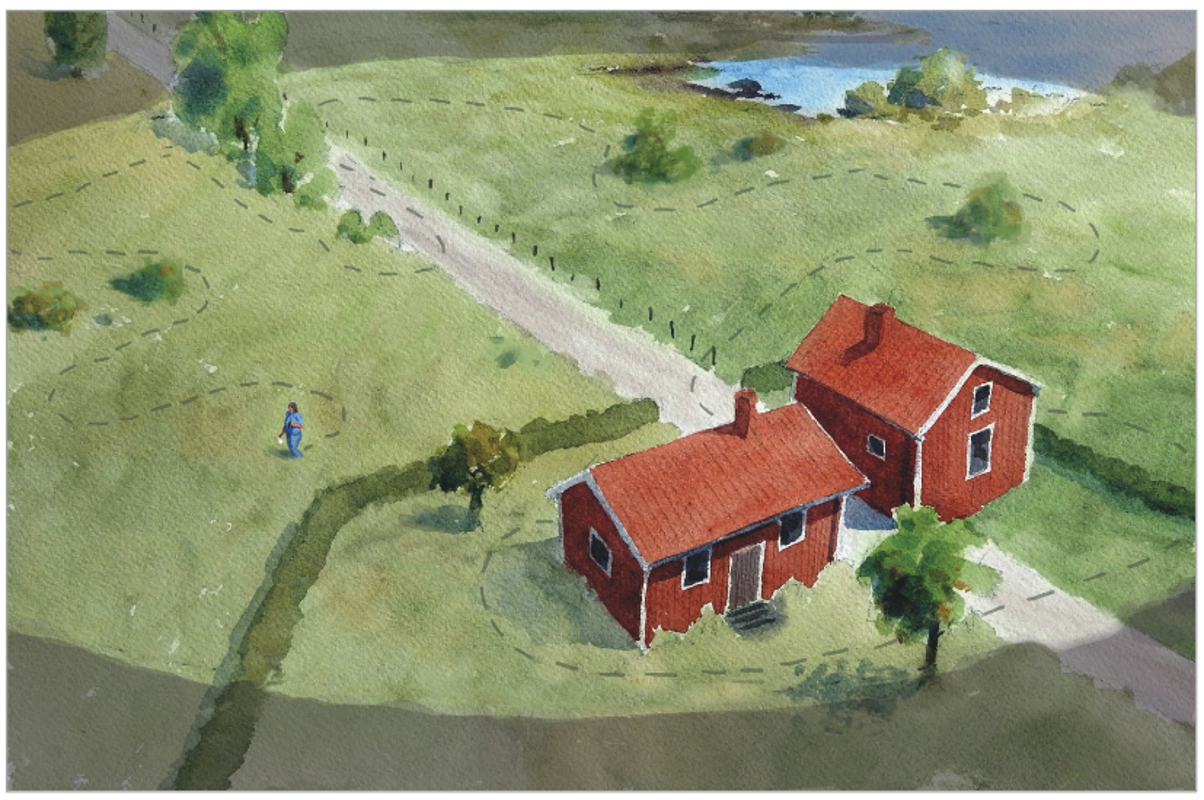
Cada punto de levantamiento incluirá la siguiente información:
-
Fecha del levantamiento
-
Coordenadas del lugar en EPSG:3857 que representan el punto central del lugar
-
Solo inicio (el recuento de puntos del sitio)
-
Condiciones meteorológicas en el momento de la encuesta
-
Lista de especies observadas y el número de ejemplares de cada especie durante el muestreo. En los muestreos donde no se observaron mariposas, se indicará que no se observaron.
| Las especies inusuales o difíciles de identificar se marcan con un asterisco (*) en los registros de muestreo y el observador adjunta una fotografía para facilitar su identificación. Si el observador no pudo obtener una fotografía, la mariposa se clasifica como «mariposa indeterminada». |
Condiciones meteorológicas
Al principio de cada encuesta se recogen datos meteorológicos generales en cada lugar. Se pide a los observadores que registren información sobre la temperatura del aire, el porcentaje de insolación y la fuerza y dirección del viento.
-
La temperatura del aire a la sombra se indica en ℃.
-
El porcentaje (%) de sol, es decir, la proporción de tiempo soleado durante la encuesta, se expresa en decimales y se redondea a la décima más próxima.
-
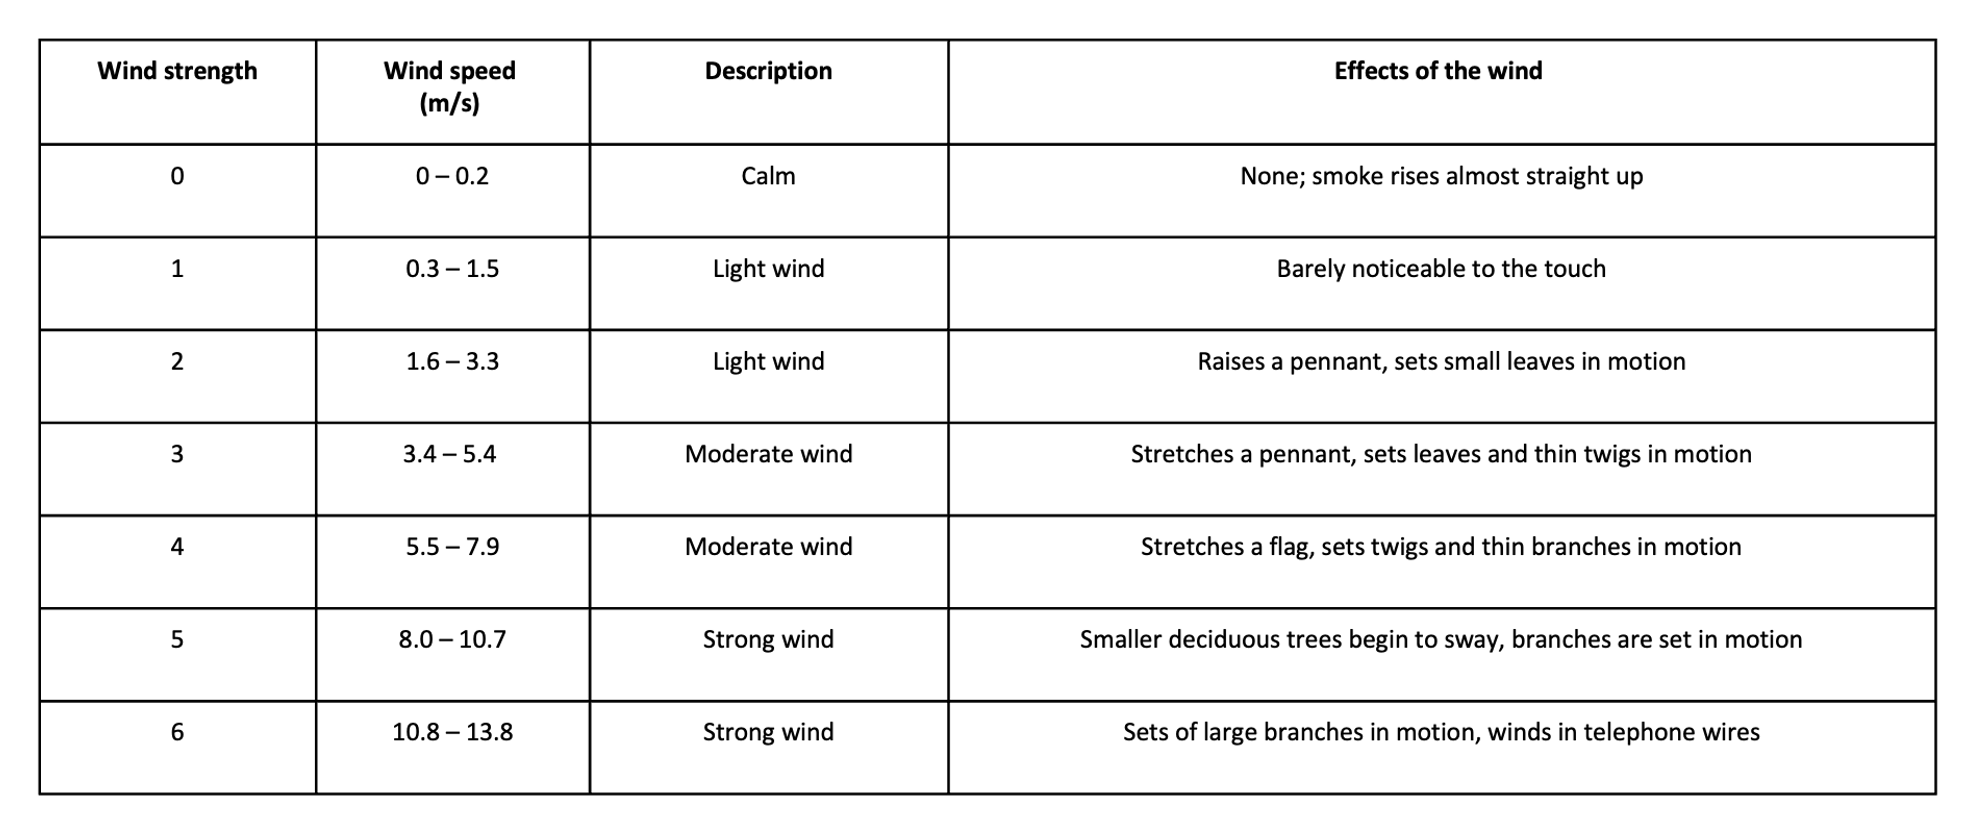
La intensidad del viento se indica en la escala de Beaufort (para más información, consulte la tabla siguiente).
-
También se informa de la dirección del viento.
Descripción de datos digitales
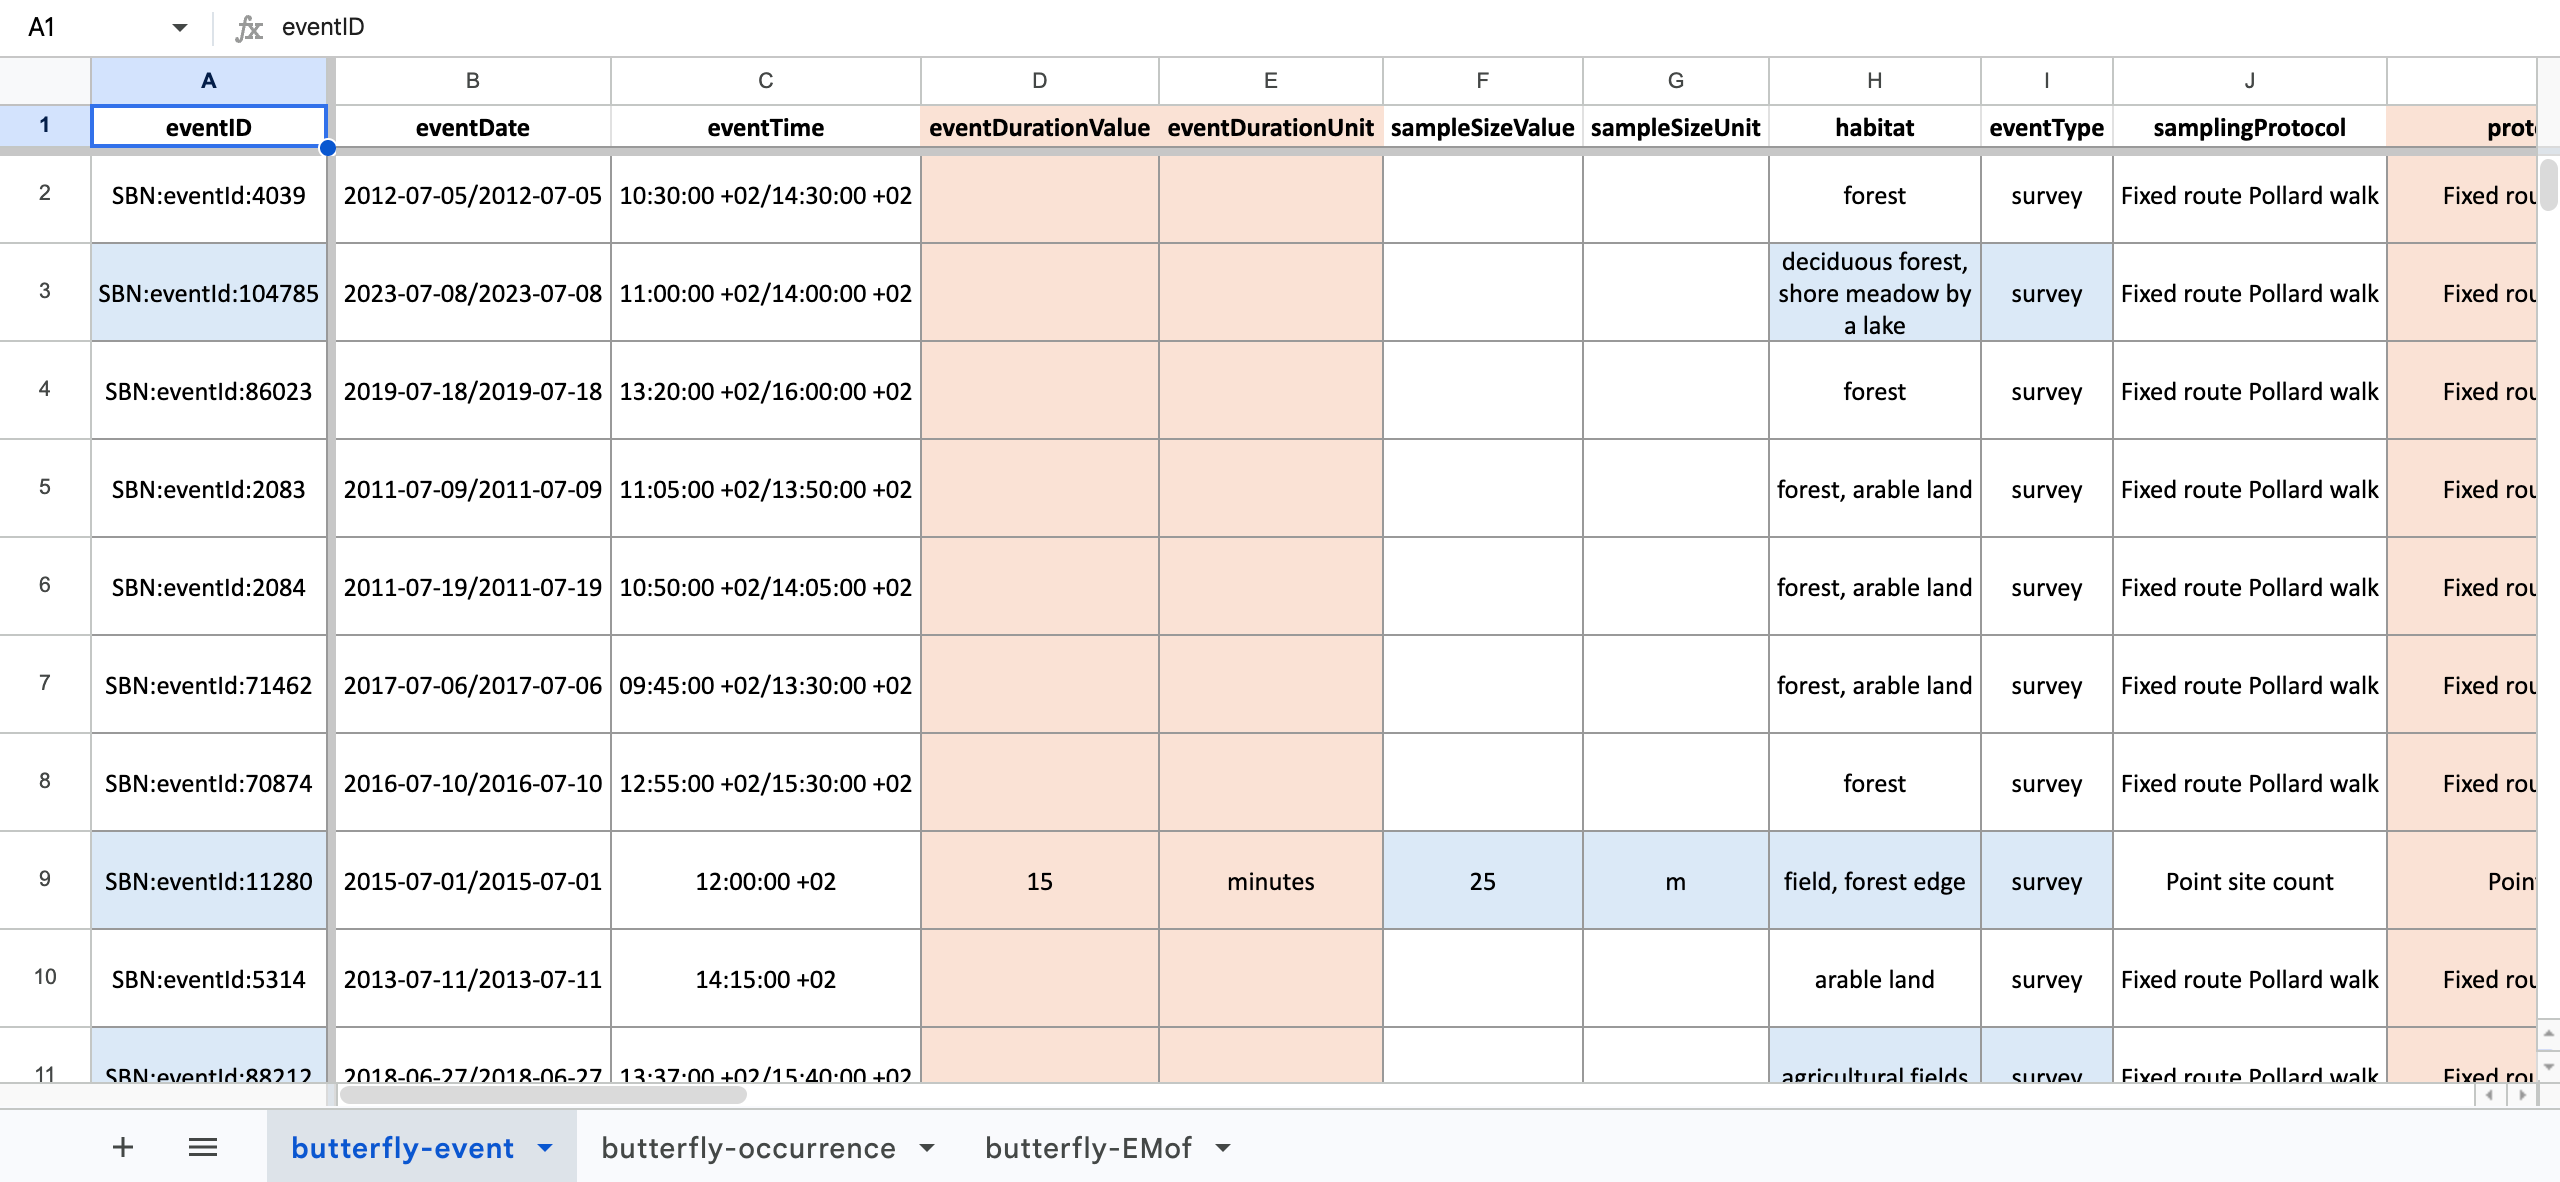
La oficina de la SBN utiliza grupos de voluntarios para digitalizar los registros en papel y elaborar hojas de cálculo digitales. Las hojas de cálculo son muy sencillas e incluyen tres hojas de datos:
-
la primera captura la información vinculada a los esfuerzos de muestreo, incluidos los encuestadores, los nombres de los sitios, la fecha de la encuesta y la ubicación
-
el segundo recoge las especies encontradas y el número de individuos observados
-
el tercero recoge el tipo de ubicación y las condiciones meteorológicas
Ejercicios
Los ejercicios individuales para este caso de uso se encuentran en los módulos correspondientes.
Hoja de ejercicios
Descargar UC-Practice-exercise-sheet_EN.docx para proporcionar sus respuestas. (2,9 MB)