Cas d’utilisation - Surveillance des papillons
|
Familiarisez-vous avec le scénario du cas pratique. Une proposition de solution sera fournie dans l’annexe des solutions. Ce cas pratique n’est pas noté. |
Scénario
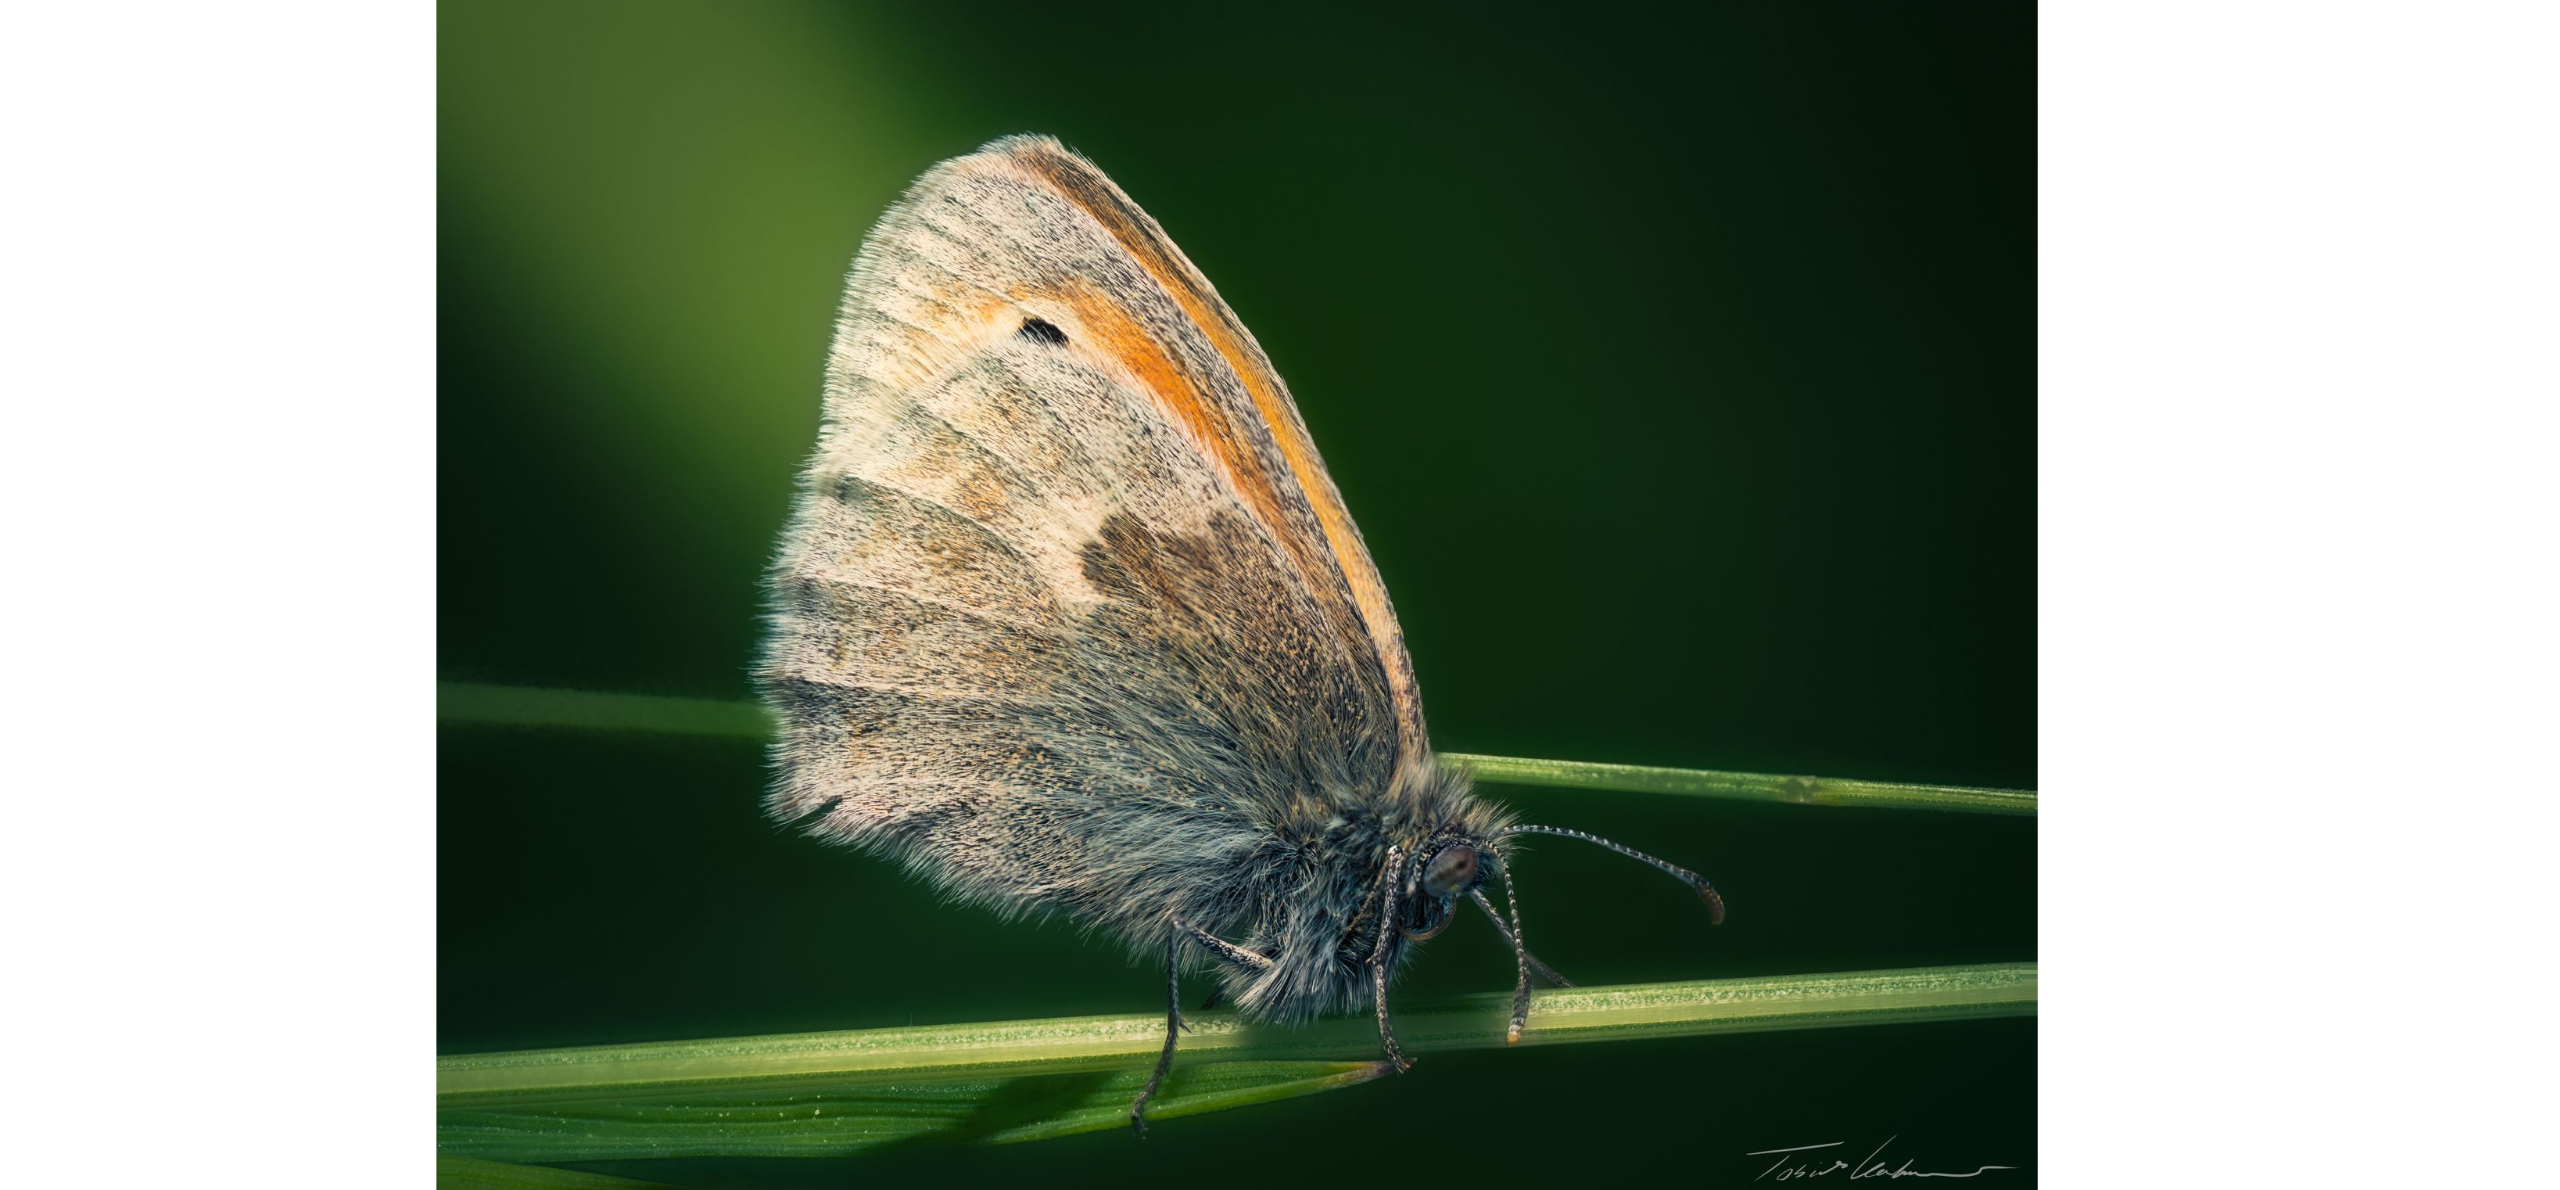
Surveillance des papillons
This narrative was developed as a basis for practical exercises in the biodiversity data mobilization course and the exercise concept and content was developed by Kate Ingenloff and Laura Anne Russell, based on previous work by Alberto González-Talaván, Danny Vélez, Larissa Smirnova, Laura Anne Russell, Mélianie Raymond and Nicolas Noé.
It is a fictionalized scenario based on a real dataset and is meant only for instructional purposes. The original dataset is attributed to Pettersson L B (2025). Swedish Butterfly Monitoring Scheme (SeBMS). Version 1.12. Department of Biology, Lund University. Sampling event dataset https://doi.org/10.15468/othndo accessed via GBIF.org on 2026-04-12.
Description
The Swedish Butterfly Network (SBN) has been monitoring the occurrence of butterflies (Lepidoptera) at a series of fixed sites 3-7 times per season on an annual basis since 2009.
This network of observers implements one of two standard protocols at each site: fixed-route Pollard walks or point counts. Butterfly observation information is captured by observers on paper data capture sheets that they send to the national SBN office.
The SBN steering committee would like to start publishing these data online to GBIF in order to strengthen collaborations with the Swedish Environmental Protection Agency, the Swedish Transport Administration, and the Swedish County Administration Boards to influence conservation policies for Lepidoptera in Sweden.
Collecte de données
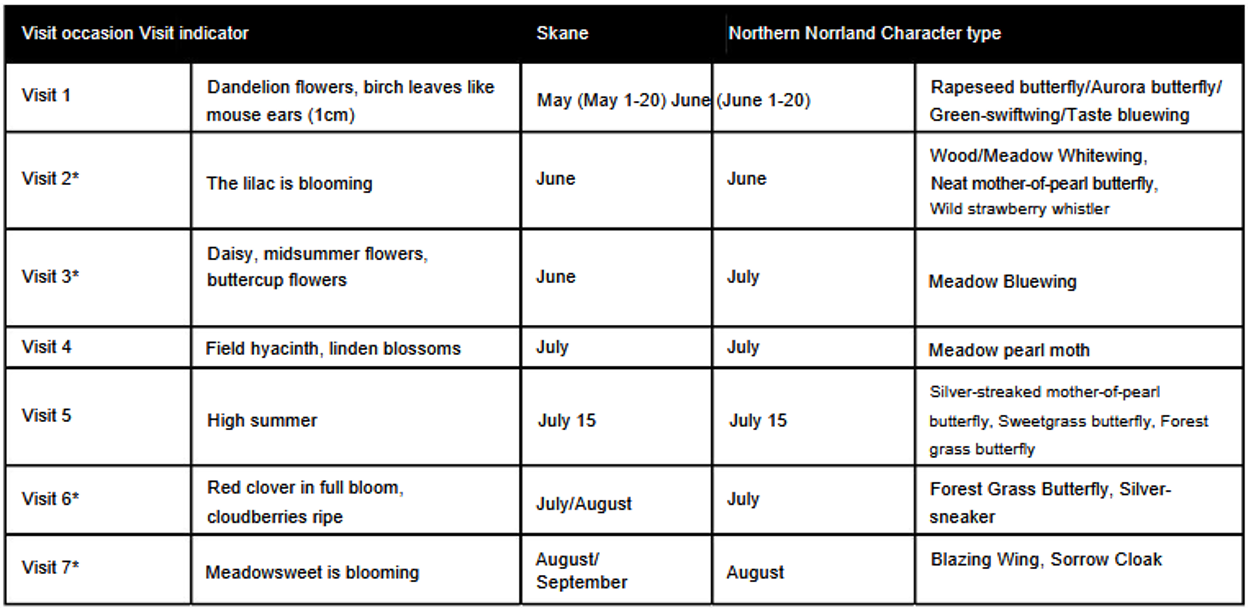
Butterfly monitoring surveys are conducted annually at more than 500 sites by volunteers from 1 April through 30 September. Sites are visited 3-7 times per season. The program does not dictate when sites are surveyed but they provide recommendations (see table below).
The monitoring scheme implements two established methods: fixed-route Pollard walk transects and point site counts. The same method is used at a site each year. These methods are described in Pollard and Yates (1993) and Pettersson et al. (2011 and 2022) and enable the monitoring scheme to assess yearly changes in (1) the number of butterflies seen and (2) species composition.
Fixed-route Pollard walk transects
Fixed-route Pollard walk transects are pre-defined routes typically 0.5-3 km in length. Surveyors follow the transect at a steady pace and identify all the butterflies observed up to 5 m in front, 5 m above, and 2.5 m to each side (see the figure below).
A transect can be any shape, including a loop. Each transect is inventoried once per visit. Some transects are divided into segments that typically represent a change in habitat. For example, a loop that follows a forest road, over a clearing, and then out onto a bog will have three segments. Each segment is inventoried once per visit.
Each survey log from a fixed-route Pollard walk survey will include the following information:
-
Survey date
-
Site coordinates in EPSG:3857 representing the center point of the site
-
Start time/end time for each segment (if applicable) otherwise for the full survey
-
Weather conditions during each segment (if applicable) otherwise for the full survey
-
A list of species observed and the total number of each species observed in each segment (if applicable) otherwise for the full survey. Surveys or segments where no butterflies were observed will include a note that zero butterflies were observed.
| Unusual or difficult to identify species are marked on survey logs with an asterisk (*) and a photo is submitted by the surveyor for identification assistance. If the surveyor was unable to get a photo, the butterfly is reported as an ‘indeterminate butterfly’. |
Point site counts
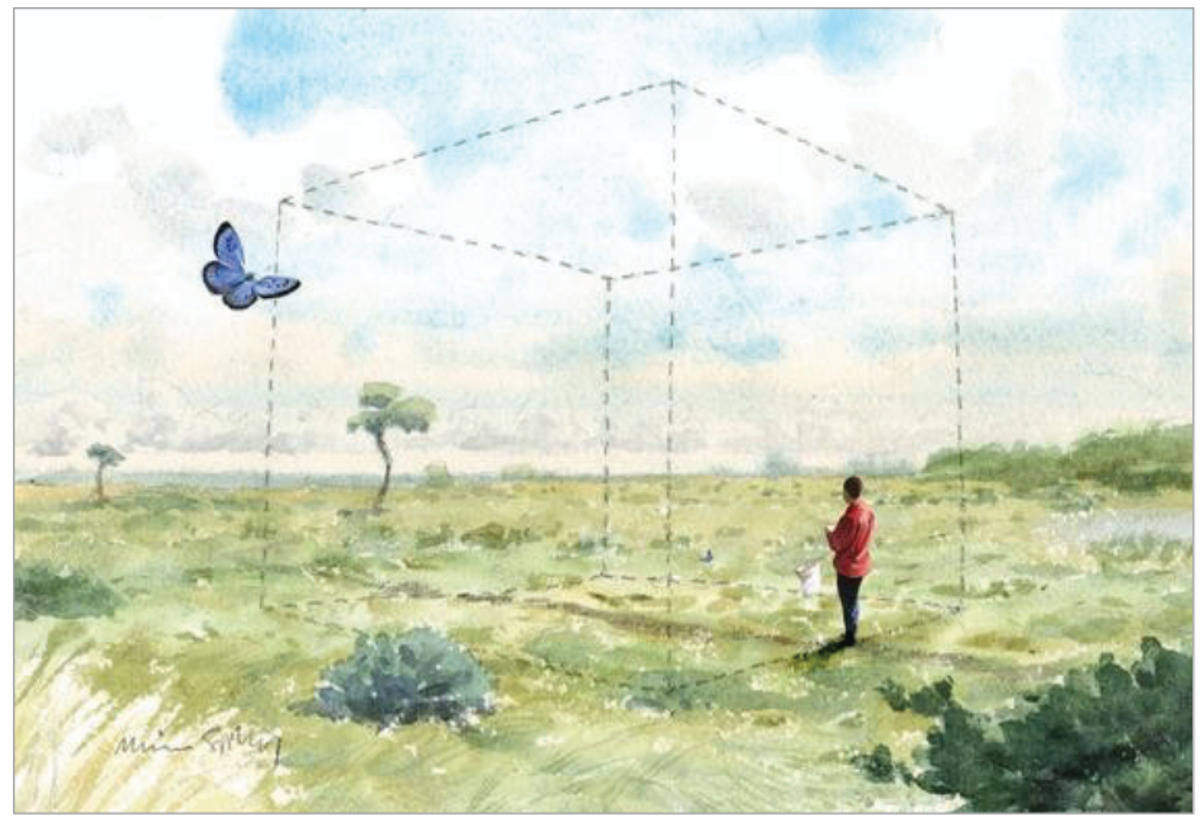
Point site counts cover an area with a 25 m radius and a height of 5 m that are surveyed for 15 minutes per visit. A point location may be completely circular with a radius of 25 meters OR it may have other shapes. Regardless of shape, the same area must be inventoried on each occasion to ensure the inventory is comparable across surveys.
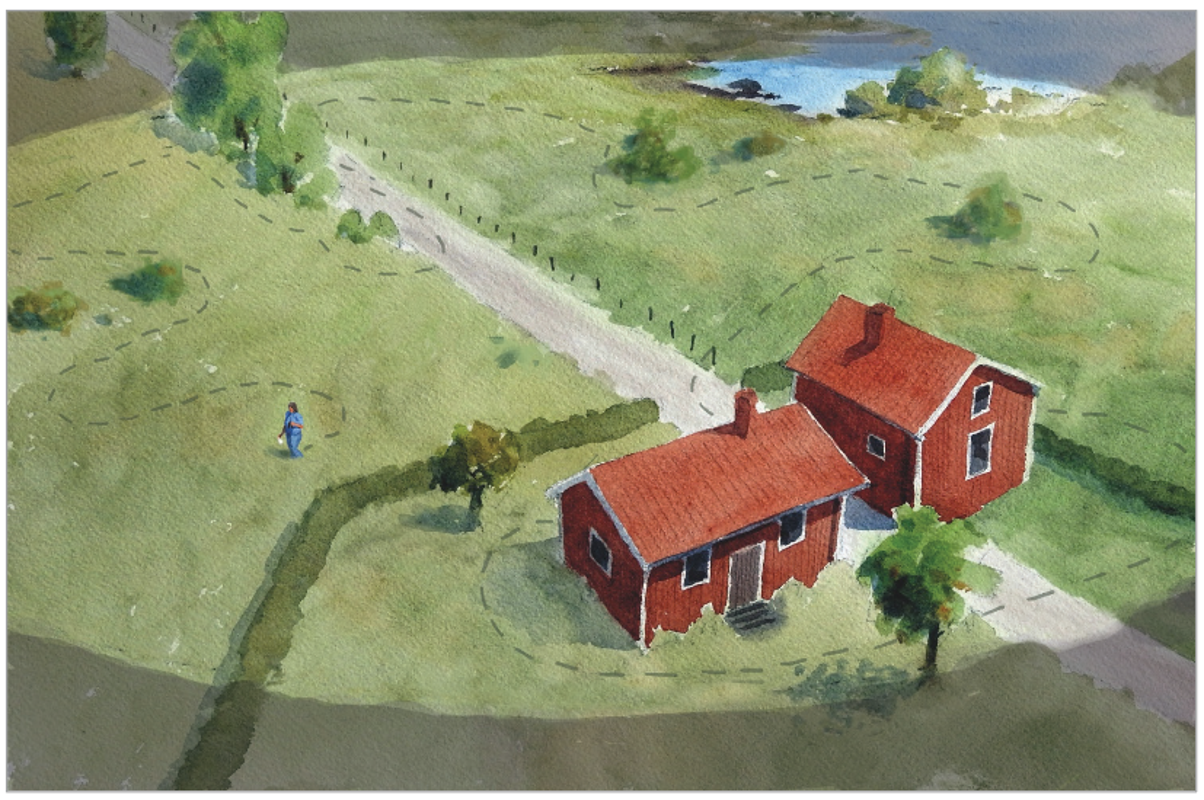
For a circular point site, the surveyor moves about the circular site for the full 15-minute period and records all butterflies that come within the circle up to 5 m above the ground. See figure below.
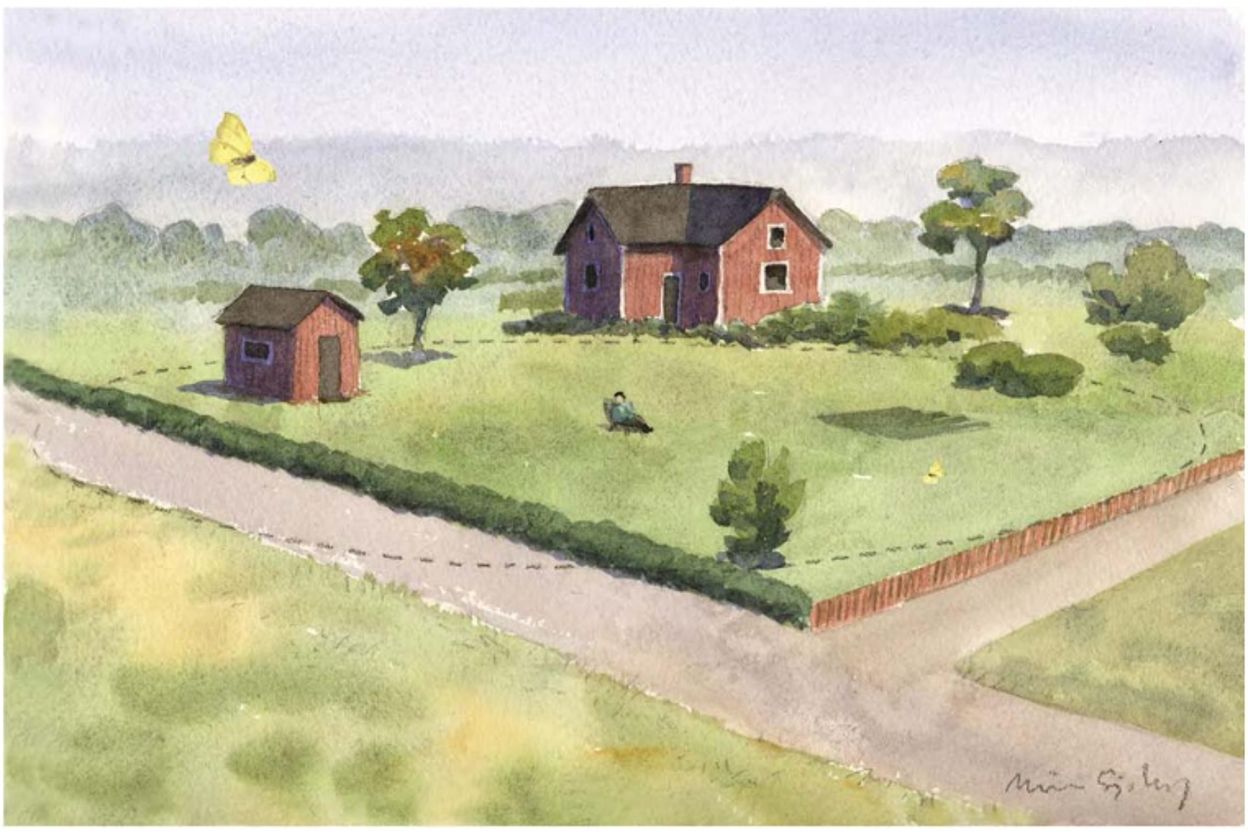
For a non-circular point site, the surveyor walks about the site for the full 15-minute period and records all butterflies they observe within the area up to 5 m above the ground. See figure below.
Each point site survey will report the following information:
-
Survey date
-
Site coordinates in EPSG:3857 representing the center point of the site
-
Start only (point site counts)
-
Weather conditions at the time of the survey
-
A list of species observed and the number of each species observed during the survey. Surveys where no butterflies were observed will include a note that zero butterflies were observed.
| Unusual or difficult to identify species are marked on survey logs with an asterisk (*) and a photo is submitted by the surveyor for identification assistance. If the surveyor was unable to get a photo, the butterfly is reported as an ‘indeterminate butterfly’. |
Weather conditions
General weather data are collected at each site at the beginning of each survey. Observers are asked to record information about air temperature, percent sunshine, and wind strength and direction.
-
Air temperature in the shade is reported in ℃.
-
Percent (%) sunshine, the proportion of time that was sunny during the survey, is reported as decimal and rounded to the nearest tenth.
-
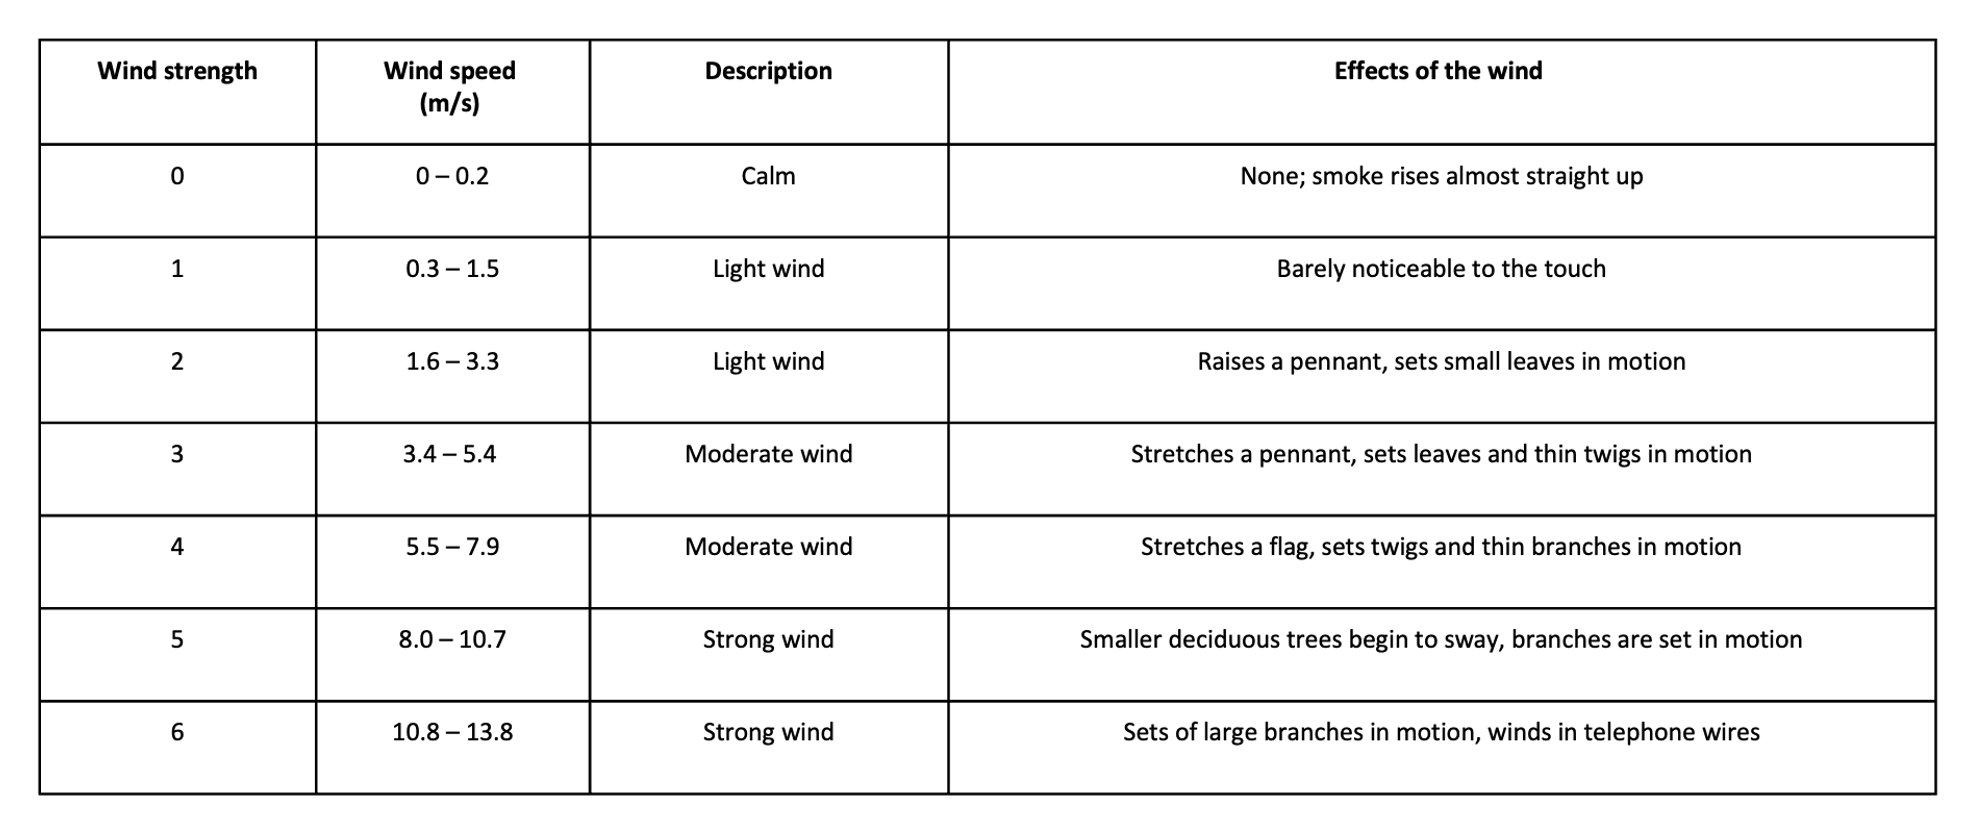
Wind strength is reported using the Beaufort scale (see the table below for more information).
-
Wind direction is also reported.
Description des données numériques
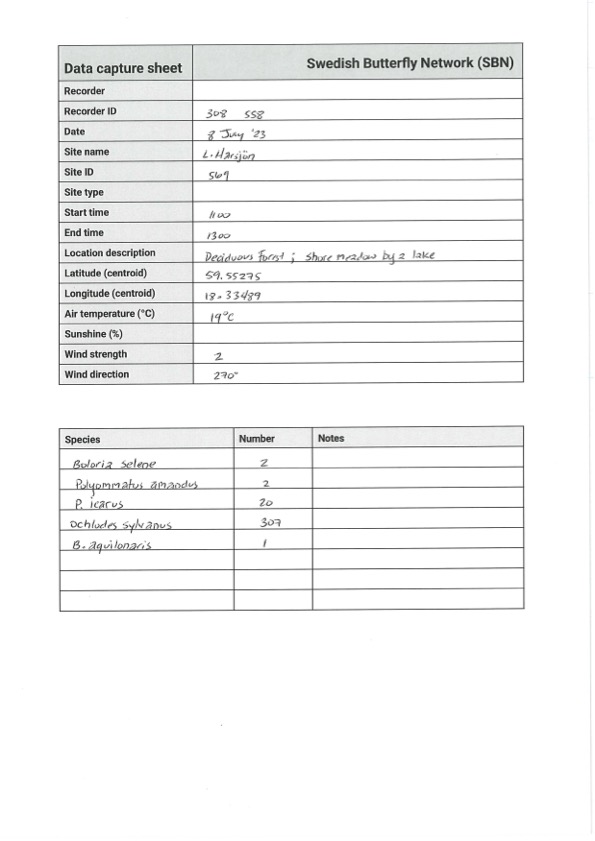
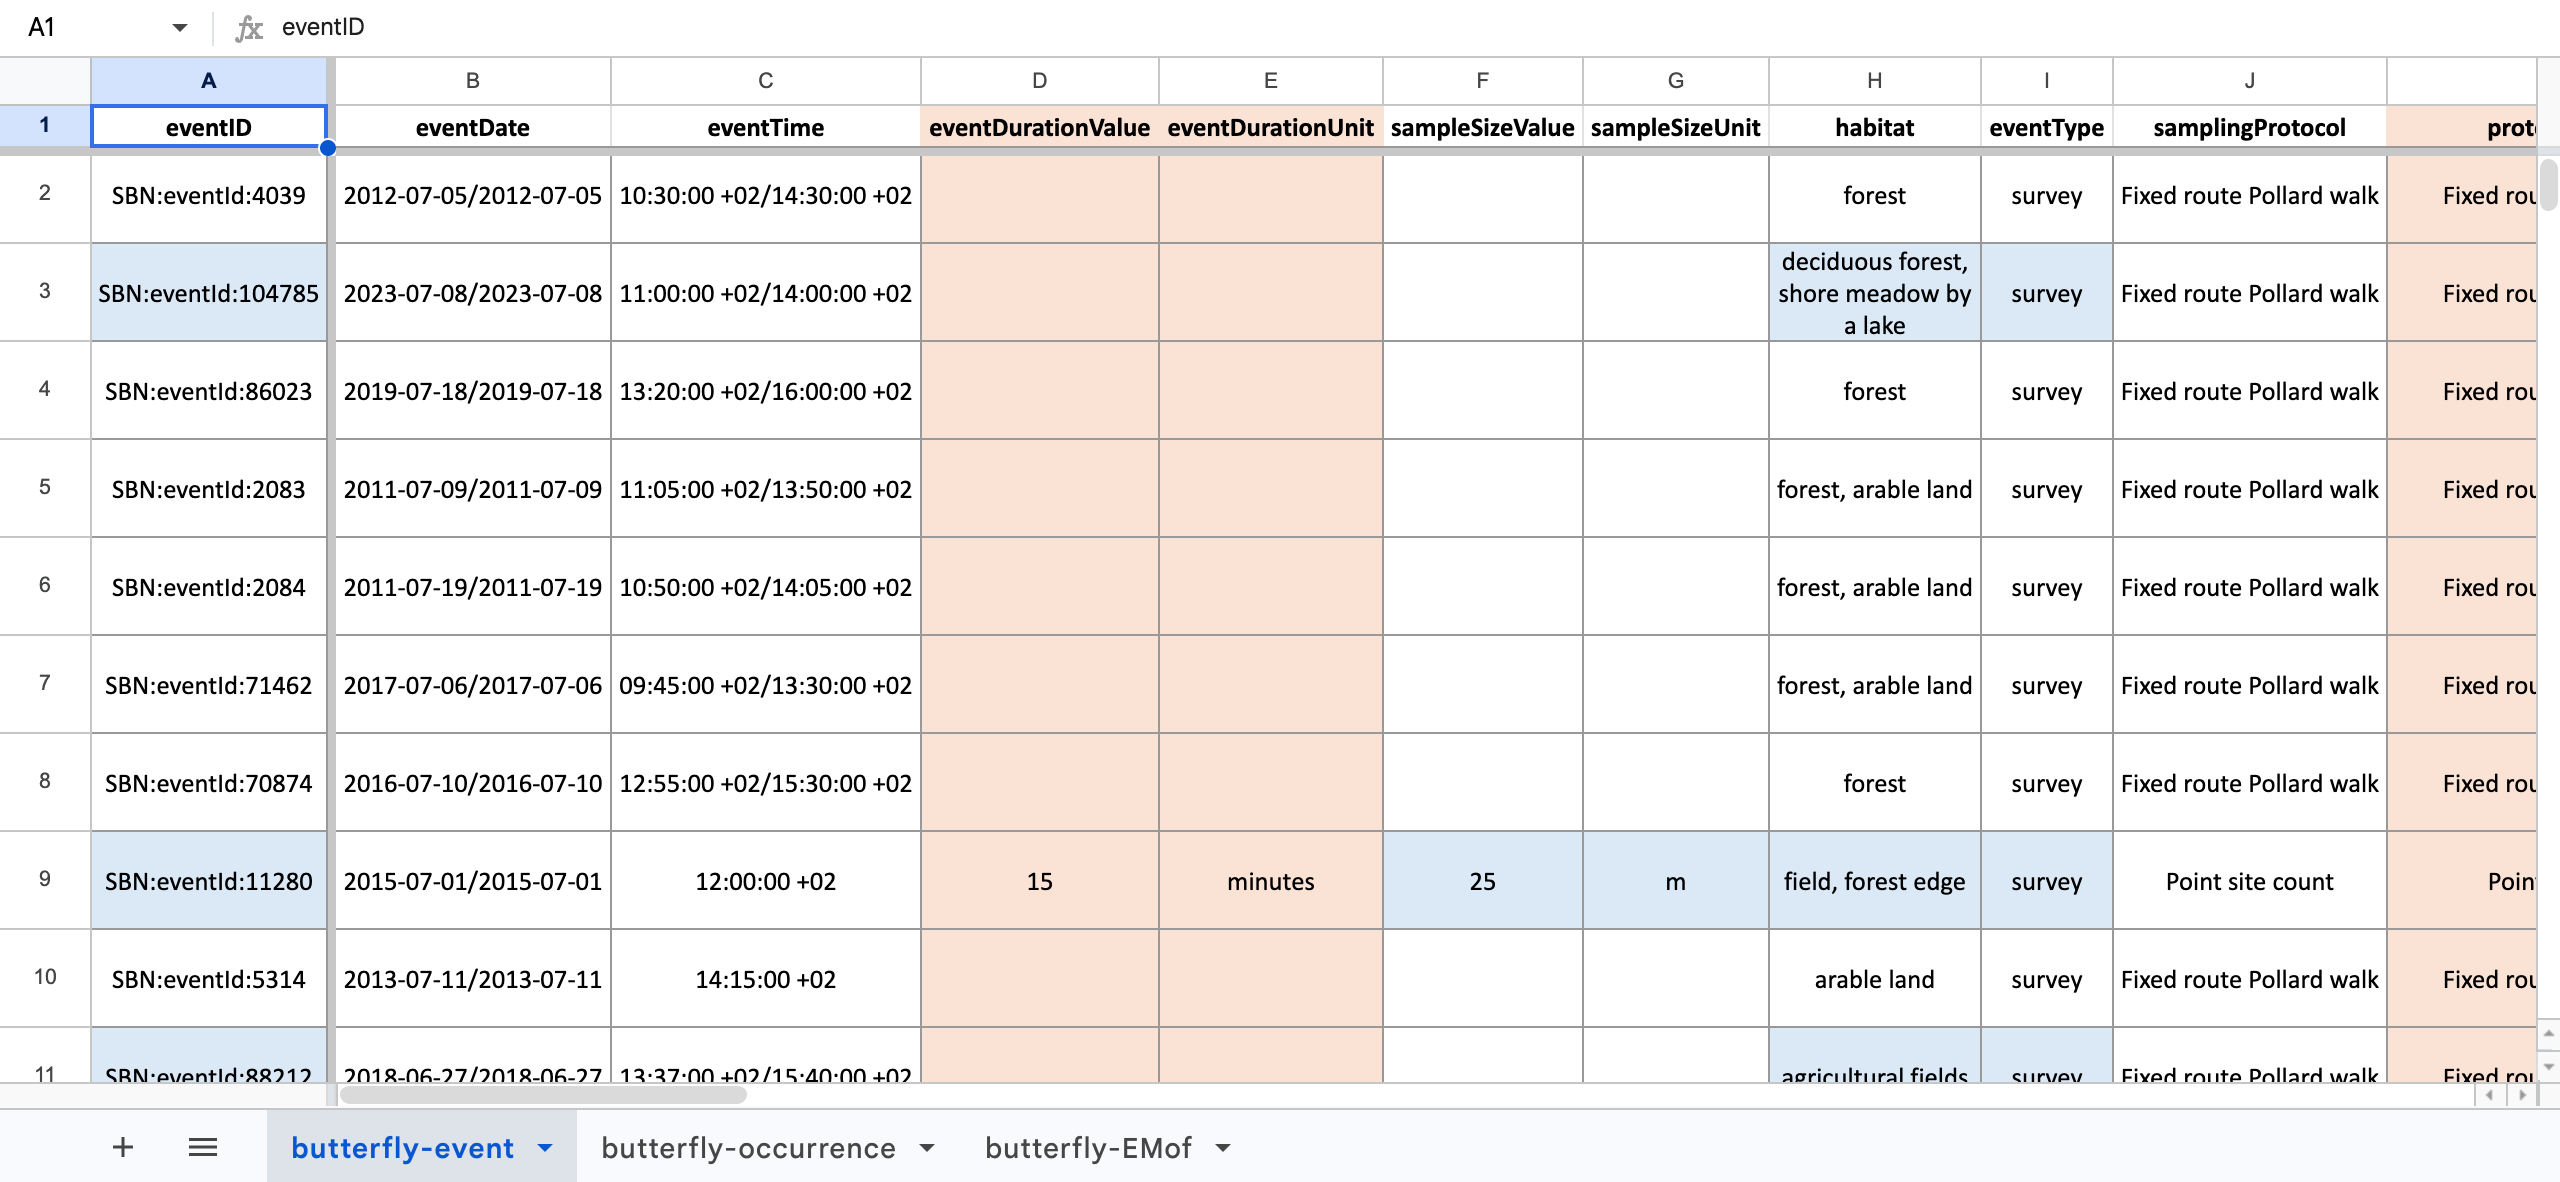
The SBN office uses groups of volunteers to digitize the paper logs and produce digital spreadsheets. The spreadsheets are very simple and include three datasheets:
-
the first captures the information linked to the sampling efforts including surveyors, site names, survey date, and location
-
the second captures the species encountered and the number of individuals observed
-
the third captures the location type and weather conditions
Exercises
The individual exercises for this use case are located in the corresponding modules.
Exercise sheet
Download UC-Practice-exercise-sheet_EN.docx to provide your answers. (2.9 MB)